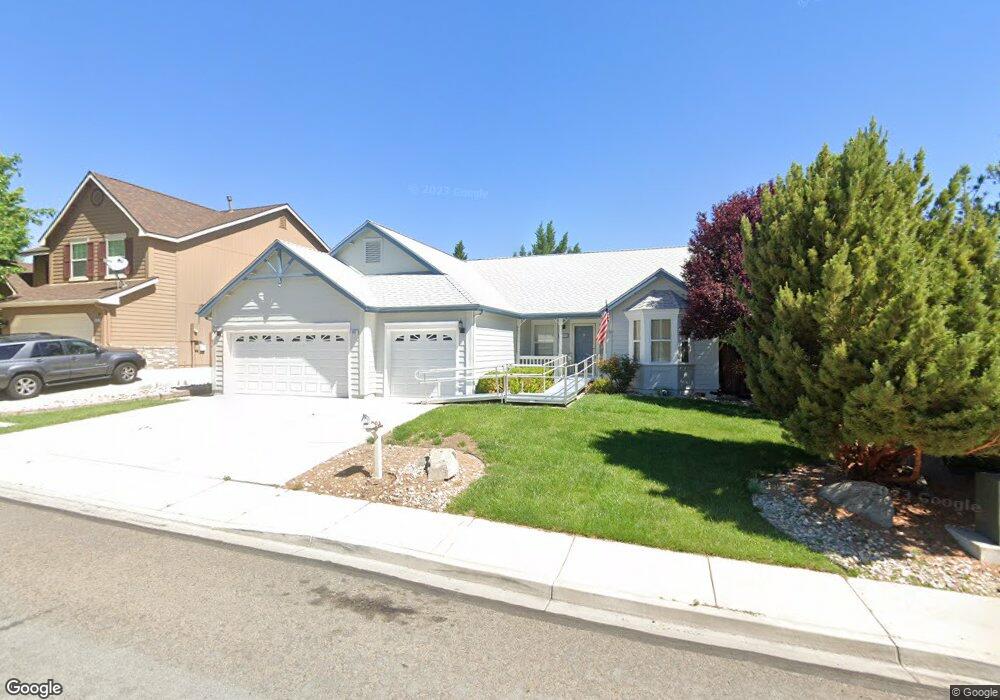
880 Francesca Way Unit 2 Sparks, NV 89436
Reed NeighborhoodEstimated Value: $581,000 - $599,000
4
Beds
2
Baths
2,056
Sq Ft
$286/Sq Ft
Est. Value
About This Home
This home is located at 880 Francesca Way Unit 2, Sparks, NV 89436 and is currently estimated at $588,029, approximately $286 per square foot. 880 Francesca Way Unit 2 is a home located in Washoe County with nearby schools including Lena Juniper Elementary School, Lou Mendive Middle School, and Edward C Reed High School.
Ownership History
Date
Name
Owned For
Owner Type
Purchase Details
Closed on
May 21, 2025
Sold by
Ammerman Sandra Barone
Bought by
Sandra Barone Ammerman Family Trust and Ammerman
Current Estimated Value
Purchase Details
Closed on
Aug 14, 2002
Sold by
Lemaire Lew Jeffrey S and Lemaire Lew
Bought by
Ammerman Robert L and Ammerman Sandra B
Home Financials for this Owner
Home Financials are based on the most recent Mortgage that was taken out on this home.
Original Mortgage
$196,800
Interest Rate
6.51%
Purchase Details
Closed on
Mar 27, 1995
Sold by
Saddleback Associates
Bought by
Lemaire Lew Jeffery S and Lemaire Lew
Home Financials for this Owner
Home Financials are based on the most recent Mortgage that was taken out on this home.
Original Mortgage
$152,150
Interest Rate
8.86%
Create a Home Valuation Report for This Property
The Home Valuation Report is an in-depth analysis detailing your home's value as well as a comparison with similar homes in the area
Home Values in the Area
Average Home Value in this Area
Purchase History
| Date | Buyer | Sale Price | Title Company |
|---|---|---|---|
| Sandra Barone Ammerman Family Trust | -- | None Listed On Document | |
| Ammerman Robert L | $246,000 | First Centennial Title Co | |
| Lemaire Lew Jeffery S | $179,500 | Founders Title Company |
Source: Public Records
Mortgage History
| Date | Status | Borrower | Loan Amount |
|---|---|---|---|
| Previous Owner | Ammerman Robert L | $196,800 | |
| Previous Owner | Lemaire Lew Jeffery S | $152,150 |
Source: Public Records
Tax History Compared to Growth
Tax History
| Year | Tax Paid | Tax Assessment Tax Assessment Total Assessment is a certain percentage of the fair market value that is determined by local assessors to be the total taxable value of land and additions on the property. | Land | Improvement |
|---|---|---|---|---|
| 2025 | $2,819 | $122,157 | $43,325 | $78,832 |
| 2024 | $2,819 | $117,887 | $38,138 | $79,750 |
| 2023 | $2,740 | $116,916 | $40,964 | $75,952 |
| 2022 | $2,664 | $93,734 | $30,224 | $63,510 |
| 2021 | $2,596 | $87,139 | $23,874 | $63,265 |
| 2020 | $2,513 | $87,521 | $23,874 | $63,647 |
| 2019 | $2,439 | $85,712 | $23,142 | $62,570 |
| 2018 | $2,368 | $78,316 | $16,924 | $61,392 |
| 2017 | $2,300 | $78,494 | $16,825 | $61,669 |
| 2016 | $2,239 | $80,492 | $17,323 | $63,169 |
| 2015 | $2,236 | $77,648 | $14,065 | $63,583 |
| 2014 | $2,137 | $72,212 | $11,205 | $61,007 |
| 2013 | -- | $59,626 | $9,210 | $50,416 |
Source: Public Records
Map
Nearby Homes
- 1031 Vintage Hills Pkwy
- 3988 Ella Jayne Ct Unit Lot 6
- 3602 Oakridge Dr
- Plan 4 at Eagle Peak
- Plan 5 at Eagle Peak
- Plan 2 at Eagle Peak
- Plan 1 at Eagle Peak
- Plan 3 at Eagle Peak
- 930 Spanish Springs Rd
- 510 S Sand Crane Cir
- 1069 Palmwood Dr
- 4515 Whitney Cir
- 3595 Rocky Ridge Ct
- 519 N Sand Crane Cir
- 4434 Whitney Cir
- 4719 Wood Thrush Ln
- 3200 Bristle Branch Dr
- 3198 Bristle Branch Dr
- 3188 Bristle Branch Dr
- 4739 Wood Thrush Ln
- 888 Francesca Way
- 872 Francesca Way Unit 2
- 885 Vivian Dr
- 875 Vivian Dr Unit 2
- 864 Francesca Way Unit 2
- 881 Francesca Way
- 865 Vivian Dr Unit 2
- 875 Francesca Way
- 886 Francesca Way
- 865 Francesca Way
- 895 Christina Cir
- 855 Vivian Dr
- 856 Francesca Way
- 845 Vivian Dr
- 860 Christina Cir
- 859 Francesca Way Unit 2
- 885 Christina Cir
- 886 Vivian Dr
- 876 Vivian Dr
- 896 Vivian Dr