Estimated Value: $363,666 - $407,000
5
Beds
3
Baths
2,854
Sq Ft
$137/Sq Ft
Est. Value
About This Home
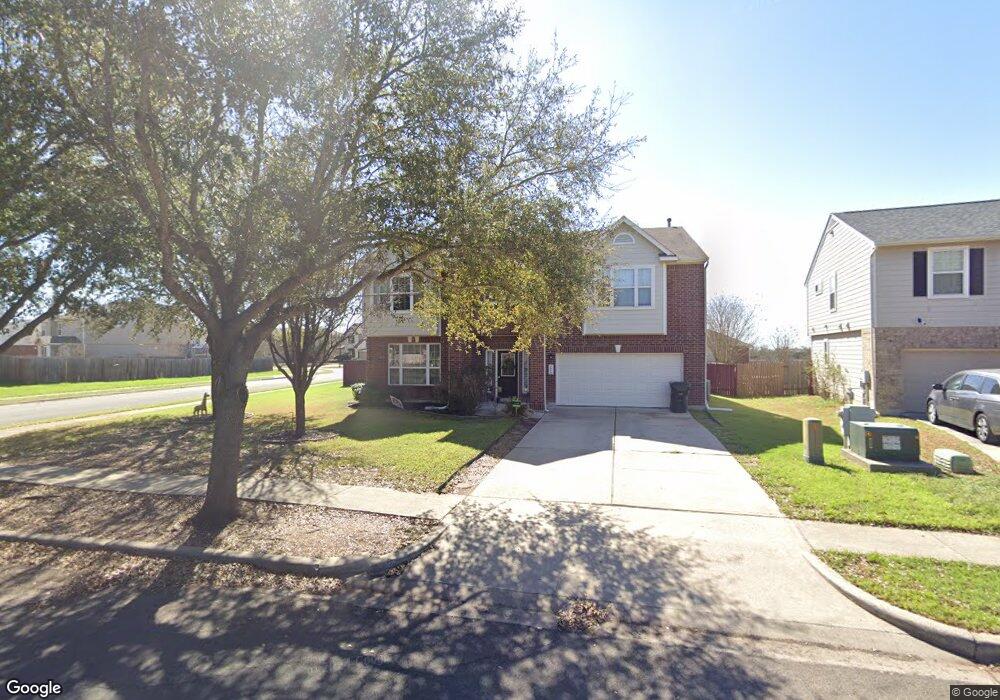
This home is located at 880 Hometown Pkwy, Kyle, TX 78640 and is currently estimated at $390,667, approximately $136 per square foot. 880 Hometown Pkwy is a home located in Hays County with nearby schools including Kyle Elementary School, Laura B Wallace Middle School, and Jack C Hays High School.
Ownership History
Date
Name
Owned For
Owner Type
Purchase Details
Closed on
May 24, 2022
Sold by
Balan Thriveny
Bought by
Balan Thriveny and Perumalil Manoj
Current Estimated Value
Home Financials for this Owner
Home Financials are based on the most recent Mortgage that was taken out on this home.
Original Mortgage
$337,500
Outstanding Balance
$319,889
Interest Rate
5%
Mortgage Type
New Conventional
Estimated Equity
$70,778
Purchase Details
Closed on
Sep 13, 2021
Sold by
Cheatham Lionel and Cheatham Cornelia A
Bought by
Texas Capitol Llc
Purchase Details
Closed on
Jul 12, 2006
Sold by
Rh Of Texas Lp
Bought by
Cheatham Lionel and Cheatham Cornelia A
Home Financials for this Owner
Home Financials are based on the most recent Mortgage that was taken out on this home.
Original Mortgage
$185,034
Interest Rate
6.6%
Mortgage Type
FHA
Create a Home Valuation Report for This Property
The Home Valuation Report is an in-depth analysis detailing your home's value as well as a comparison with similar homes in the area
Home Values in the Area
Average Home Value in this Area
Purchase History
| Date | Buyer | Sale Price | Title Company |
|---|---|---|---|
| Balan Thriveny | -- | None Listed On Document | |
| Texas Capitol Llc | -- | Independence Title | |
| Balan Thriveny | -- | Independence Title | |
| Cheatham Lionel | -- | Rtc |
Source: Public Records
Mortgage History
| Date | Status | Borrower | Loan Amount |
|---|---|---|---|
| Open | Balan Thriveny | $337,500 | |
| Previous Owner | Cheatham Lionel | $185,034 |
Source: Public Records
Tax History Compared to Growth
Tax History
| Year | Tax Paid | Tax Assessment Tax Assessment Total Assessment is a certain percentage of the fair market value that is determined by local assessors to be the total taxable value of land and additions on the property. | Land | Improvement |
|---|---|---|---|---|
| 2025 | $8,565 | $408,650 | $74,340 | $334,310 |
| 2024 | $8,565 | $384,855 | $70,800 | $314,055 |
| 2023 | $10,594 | $480,530 | $94,160 | $386,370 |
| 2022 | $11,257 | $468,700 | $79,800 | $388,900 |
| 2021 | $7,589 | $290,760 | $42,000 | $248,760 |
| 2020 | $6,576 | $266,450 | $28,000 | $238,450 |
| 2019 | $7,272 | $267,560 | $28,000 | $239,560 |
| 2018 | $7,202 | $264,300 | $18,360 | $245,940 |
| 2017 | $7,057 | $254,340 | $18,360 | $235,980 |
| 2016 | $6,611 | $238,260 | $18,900 | $219,360 |
| 2015 | $5,262 | $221,749 | $18,000 | $207,730 |
Source: Public Records
Map
Nearby Homes
- 952 Hometown Pkwy
- 964 Hometown Pkwy
- 125 Pine Cove
- 172 Chaparro Dr
- 154 Larch Cove
- 161 Coneflower Dr
- 1040 Verna Brooks Way
- 3842 Ranch To Market Road 150
- 228 San Felipe Dr
- 223 San Felipe Dr
- 230 San Felipe Dr
- 215 Spruce Dr
- 292 Spruce Dr
- 376 Sweet Gum
- 1332 Modoc Way
- 265 Fawn River Run
- 273 Fawn River Run
- 261 Fawn River Run
- 326 Cypress Forest Dr
- 588 Bottle Brush Dr
- 868 Hometown Pkwy
- 124 Birch Dr
- 856 Hometown Pkwy
- 904 Hometown Pkwy
- 125 Raintree Cove
- 136 Birch Dr
- 899 Hometown Pkwy
- 173 Birch Dr
- 112 Raintree Dr
- 916 Hometown Pkwy
- 148 Birch Dr
- 124 Raintree Dr
- 137 Raintree Cove
- 185 Birch Dr
- 917 Hometown Pkwy
- 160 Birch Dr
- 172 Birch Dr
- 136 Raintree Dr
- 124 Bluets Dr
- 148 Raintree Cove