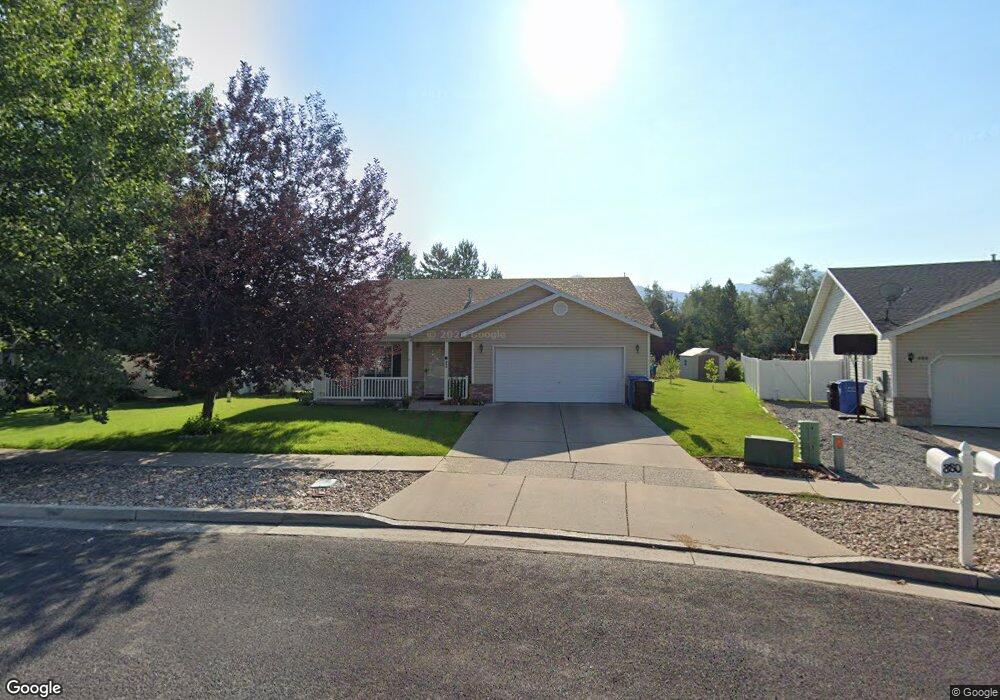
880 Mallard Loop Logan, UT 84321
Woodruff NeighborhoodEstimated Value: $399,520 - $427,000
3
Beds
2
Baths
1,400
Sq Ft
$294/Sq Ft
Est. Value
About This Home
This home is located at 880 Mallard Loop, Logan, UT 84321 and is currently estimated at $411,380, approximately $293 per square foot. 880 Mallard Loop is a home located in Cache County with nearby schools including Woodruff School, Mount Logan Middle School, and Logan High School.
Ownership History
Date
Name
Owned For
Owner Type
Purchase Details
Closed on
Aug 4, 2021
Sold by
Benson Sue C and Benson Family Trust
Bought by
Morrill Jake
Current Estimated Value
Home Financials for this Owner
Home Financials are based on the most recent Mortgage that was taken out on this home.
Original Mortgage
$230,400
Outstanding Balance
$208,144
Interest Rate
2.9%
Mortgage Type
New Conventional
Estimated Equity
$203,236
Purchase Details
Closed on
Jun 24, 2021
Sold by
Barber Darla B and Peterson Lori B
Bought by
Benson Family Trust and Benson
Home Financials for this Owner
Home Financials are based on the most recent Mortgage that was taken out on this home.
Original Mortgage
$230,400
Outstanding Balance
$208,144
Interest Rate
2.9%
Mortgage Type
New Conventional
Estimated Equity
$203,236
Purchase Details
Closed on
May 12, 2021
Sold by
Benson Clayhe Vernal
Bought by
Benson Family Trust and Hoggan
Purchase Details
Closed on
Dec 22, 2006
Sold by
Benson Clayne V and Benson Sue C
Bought by
Benson Clayne and Benson Sue C
Create a Home Valuation Report for This Property
The Home Valuation Report is an in-depth analysis detailing your home's value as well as a comparison with similar homes in the area
Home Values in the Area
Average Home Value in this Area
Purchase History
| Date | Buyer | Sale Price | Title Company |
|---|---|---|---|
| Morrill Jake | -- | American Secure Title Logan | |
| Benson Family Trust | -- | None Listed On Document | |
| Benson Family Trust | -- | -- | |
| Barber Darla B | -- | None Listed On Document | |
| Benson Clayne | -- | None Available |
Source: Public Records
Mortgage History
| Date | Status | Borrower | Loan Amount |
|---|---|---|---|
| Open | Morrill Jake | $230,400 |
Source: Public Records
Tax History
| Year | Tax Paid | Tax Assessment Tax Assessment Total Assessment is a certain percentage of the fair market value that is determined by local assessors to be the total taxable value of land and additions on the property. | Land | Improvement |
|---|---|---|---|---|
| 2025 | $1,719 | $222,300 | $0 | $0 |
| 2024 | $1,780 | $222,950 | $0 | $0 |
| 2023 | $1,846 | $220,440 | $0 | $0 |
| 2022 | $1,696 | $189,090 | $0 | $0 |
| 2021 | $1,546 | $266,230 | $43,000 | $223,230 |
| 2020 | $1,298 | $201,252 | $43,000 | $158,252 |
| 2019 | $1,357 | $201,251 | $43,000 | $158,251 |
| 2018 | $1,334 | $180,610 | $43,000 | $137,610 |
| 2017 | $1,241 | $88,880 | $0 | $0 |
| 2016 | $1,287 | $88,880 | $0 | $0 |
| 2015 | $1,199 | $82,725 | $0 | $0 |
| 2014 | $1,084 | $82,725 | $0 | $0 |
| 2013 | -- | $82,725 | $0 | $0 |
Source: Public Records
Map
Nearby Homes
- 591 Southwest St
- 553 Center Ave
- 1206 S 900 W
- 501 Southwest St
- 562 S 1215 W Unit 135
- 1214 W 575 S
- 1204 W 575 S
- 1210 W 575 S Unit 163
- 1210 W 575 S
- 551 S 1215 W Unit 131
- 539 S 1215 W Unit 129
- 508 S 1215 W Unit 144
- 1099 Three Pointe Ave
- 1239 W 575 S
- 952 W 330 S
- 1400 S 940 W
- 1031 W 350 S
- 370 S 1200 W Unit 2
- 420 S 1400 W
- 207 Sunstone Cir
- 872 Mallard Loop
- 15 Mallard Loop Unit 59
- 155 Mallard Loop Unit 76
- 10 Mallard Loop Unit 58
- 862 Mallard Loop
- 878 Mallard Loop
- 877 Mallard Loop
- 863 Mallard Loop
- 882 Mallard Loop
- 852 Mallard Loop
- 878 Meadowbrook Dr
- 851 Mallard Loop
- 947 W 890 S Unit 68
- 913 W 890 S Unit 73
- 860 Meadowbrook Dr
- 860 Meadowbrook Dr Unit 77
- 902 Meadowbrook Dr Unit 75
- 842 Mallard Loop
- 856 Meadowbrook Dr
- 914 Meadowbrook Dr
Your Personal Tour Guide
Ask me questions while you tour the home.