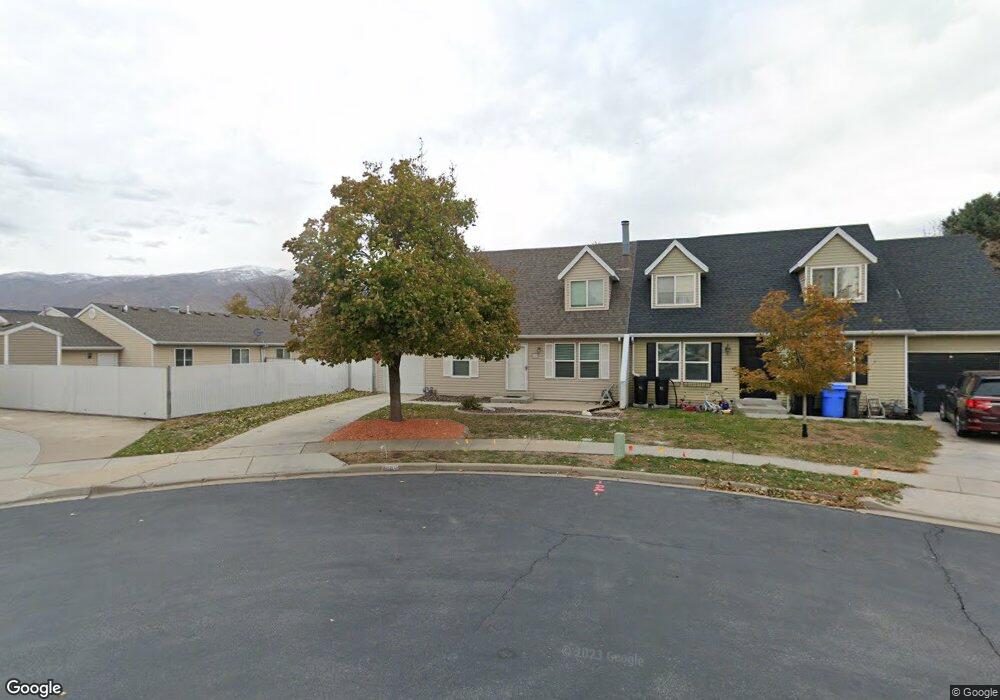
880 Raintree Cir West Bountiful, UT 84087
Estimated Value: $413,117 - $472,000
3
Beds
2
Baths
1,680
Sq Ft
$264/Sq Ft
Est. Value
About This Home
This home is located at 880 Raintree Cir, West Bountiful, UT 84087 and is currently estimated at $443,529, approximately $264 per square foot. 880 Raintree Cir is a home located in Davis County with nearby schools including West Bountiful Elementary School, Bountiful Junior High School, and Viewmont High School.
Ownership History
Date
Name
Owned For
Owner Type
Purchase Details
Closed on
Dec 18, 2003
Sold by
Holt Kristy M and Buttars Lori
Bought by
Buttars Lori
Current Estimated Value
Home Financials for this Owner
Home Financials are based on the most recent Mortgage that was taken out on this home.
Original Mortgage
$125,187
Outstanding Balance
$58,374
Interest Rate
5.97%
Mortgage Type
FHA
Estimated Equity
$385,155
Purchase Details
Closed on
Aug 31, 2001
Sold by
Streadbeck Ann
Bought by
Holt Kristy M and Buttars Lori
Home Financials for this Owner
Home Financials are based on the most recent Mortgage that was taken out on this home.
Original Mortgage
$124,053
Interest Rate
7.09%
Purchase Details
Closed on
Sep 29, 1998
Sold by
Acree Cheryl K and Eugster Irene G
Bought by
Streadbeck Ann
Home Financials for this Owner
Home Financials are based on the most recent Mortgage that was taken out on this home.
Original Mortgage
$123,773
Interest Rate
6.88%
Mortgage Type
FHA
Create a Home Valuation Report for This Property
The Home Valuation Report is an in-depth analysis detailing your home's value as well as a comparison with similar homes in the area
Home Values in the Area
Average Home Value in this Area
Purchase History
| Date | Buyer | Sale Price | Title Company |
|---|---|---|---|
| Buttars Lori | -- | Aspen Title Ins Agency L | |
| Holt Kristy M | -- | Bonneville Title Company Inc | |
| Streadbeck Ann | -- | Bonneville Title Company Inc |
Source: Public Records
Mortgage History
| Date | Status | Borrower | Loan Amount |
|---|---|---|---|
| Open | Buttars Lori | $125,187 | |
| Closed | Holt Kristy M | $124,053 | |
| Previous Owner | Streadbeck Ann | $123,773 |
Source: Public Records
Tax History Compared to Growth
Tax History
| Year | Tax Paid | Tax Assessment Tax Assessment Total Assessment is a certain percentage of the fair market value that is determined by local assessors to be the total taxable value of land and additions on the property. | Land | Improvement |
|---|---|---|---|---|
| 2025 | $2,380 | $208,450 | $102,226 | $106,224 |
| 2024 | $2,247 | $201,300 | $83,163 | $118,137 |
| 2023 | $2,212 | $364,000 | $163,834 | $200,166 |
| 2022 | $2,171 | $199,650 | $0 | $199,650 |
| 2021 | $2,043 | $289,000 | $36,000 | $253,000 |
| 2020 | $1,795 | $251,000 | $35,400 | $215,600 |
| 2019 | $1,753 | $243,000 | $34,000 | $209,000 |
| 2018 | $1,638 | $224,000 | $34,000 | $190,000 |
| 2016 | $1,304 | $96,415 | $18,700 | $77,715 |
| 2015 | $1,210 | $84,810 | $18,700 | $66,110 |
| 2014 | $1,271 | $91,616 | $20,983 | $70,633 |
| 2013 | -- | $78,523 | $11,941 | $66,582 |
Source: Public Records
Map
Nearby Homes
- 825 W 1320 N
- 767 W 220 N
- 280 N 1100 W
- 790 N 500 W
- 637 W 1600 N
- 1084 W Audrey Ln Unit 20
- 1084 W Audrey Ln
- 366 W 1000 N
- 340 N 500 W Unit 204
- 399 W 400 N Unit 47
- Lincoln Farmhouse Plan at Belmont Farms
- Belmont Traditional Plan at Belmont Farms
- Hampton Traditional Plan at Belmont Farms
- 789 W 1950 N
- 680 W 500 S Unit 22
- 680 W 500 S Unit 17
- 988 W 1950 N Unit 134
- 2035 N 800 W
- 1503 N 300 W
- 553 N 200 W
- 879 Raintree Cir
- 875 Summer Tree Dr
- 869 Summer Tree Dr
- 882 Raintree Cir
- 947 Pinetree Cir
- 933 Pinetree Cir
- 965 Pinetree Cir
- 881 Raintree Cir
- 981 Pinetree Cir
- 885 Raintree Cir
- 894 Raintree Cir
- 932 N 900 W
- 925 Pinetree Cir
- 889 Raintree Cir
- 895 Raintree Cir
- 868 Summer Tree Dr
- 876 Summer Tree Dr
- 923 Pinetree Cir
- 882 Summer Tree Dr
- 862 Summer Tree Dr