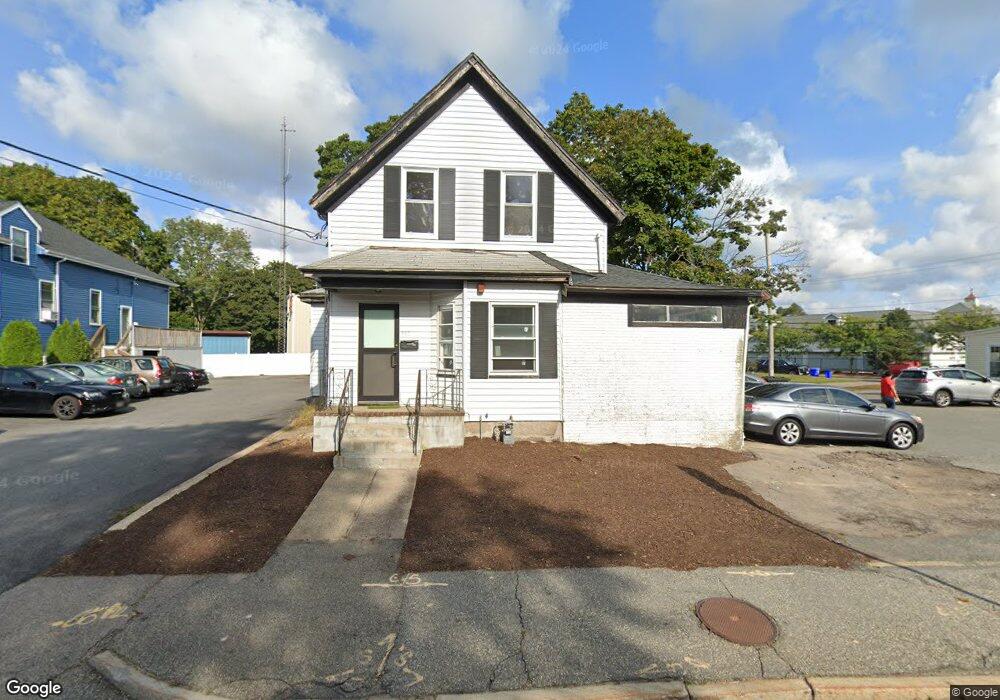
880 S Franklin St Holbrook, MA 02343
Estimated Value: $341,000 - $537,000
4
Beds
1
Bath
1,262
Sq Ft
$356/Sq Ft
Est. Value
About This Home
This home is located at 880 S Franklin St, Holbrook, MA 02343 and is currently estimated at $449,835, approximately $356 per square foot. 880 S Franklin St is a home located in Norfolk County with nearby schools including John F. Kennedy Elementary School, Holbrook Middle High School, and Boston Higashi School.
Ownership History
Date
Name
Owned For
Owner Type
Purchase Details
Closed on
Oct 4, 2004
Sold by
Rca Rt and Newcomb
Bought by
Marques Marcia A and Marques Roberto O
Current Estimated Value
Purchase Details
Closed on
Jun 29, 2001
Sold by
Healey Stephen H and Healey Francis J
Bought by
Rca Rt
Home Financials for this Owner
Home Financials are based on the most recent Mortgage that was taken out on this home.
Original Mortgage
$100,000
Interest Rate
7.14%
Mortgage Type
Commercial
Create a Home Valuation Report for This Property
The Home Valuation Report is an in-depth analysis detailing your home's value as well as a comparison with similar homes in the area
Home Values in the Area
Average Home Value in this Area
Purchase History
| Date | Buyer | Sale Price | Title Company |
|---|---|---|---|
| Marques Marcia A | $195,000 | -- | |
| Rca Rt | $121,100 | -- |
Source: Public Records
Mortgage History
| Date | Status | Borrower | Loan Amount |
|---|---|---|---|
| Previous Owner | Rca Rt | $100,000 |
Source: Public Records
Tax History Compared to Growth
Tax History
| Year | Tax Paid | Tax Assessment Tax Assessment Total Assessment is a certain percentage of the fair market value that is determined by local assessors to be the total taxable value of land and additions on the property. | Land | Improvement |
|---|---|---|---|---|
| 2025 | $49 | $372,100 | $226,600 | $145,500 |
| 2024 | $4,734 | $352,200 | $215,700 | $136,500 |
| 2023 | $7,642 | $250,800 | $172,100 | $78,700 |
| 2022 | $7,592 | $232,300 | $153,600 | $78,700 |
| 2021 | $7,309 | $224,900 | $146,200 | $78,700 |
| 2020 | $7,232 | $211,600 | $132,900 | $78,700 |
| 2019 | $7,133 | $197,100 | $126,800 | $70,300 |
| 2018 | $7,390 | $191,200 | $122,000 | $69,200 |
| 2017 | $7,149 | $179,300 | $111,100 | $68,200 |
| 2016 | $6,526 | $173,900 | $105,700 | $68,200 |
| 2015 | $6,288 | $171,700 | $103,500 | $68,200 |
| 2014 | $6,210 | $171,700 | $103,500 | $68,200 |
Source: Public Records
Map
Nearby Homes
- 5 Brookville Ave
- 719 S Franklin St Unit L Block 1
- 719 S Franklin St Unit D Block 1
- 719 S Franklin St Unit C Block 1
- 38 Stephen Dr
- 12 Hamilton Way
- 261 Jon Dr
- 18 Brookfield Dr
- 29 Belair Dr
- 68 Spring St
- 170 Elsie Rd
- 28 Border Rd
- 285 Hovendon Ave
- 55 Border Rd
- 690 N Quincy St
- 13 Mayflower Rd
- 63 Juniper Rd
- 35 Marion St
- 375 S Franklin St Unit 1
- 60 Bonney St
- 882 S Franklin St
- 860 S Franklin St
- 868 S Franklin (Rt 37)
- 7 South St
- 57 South St
- 7 South St Unit 1
- 7 South St Unit 5
- 5-7 South St
- 5 South St Unit 5
- 5 South St Unit 1
- 5 South St
- 884 S Franklin St
- 3 South St
- 4 South St
- 1 South St
- 2 South St
- 0001 Linwood St Unit 1
- 30 South St
- 890 S Franklin St
- 894 S Franklin St