Estimated Value: $415,000 - $464,000
Studio
--
Bath
1,658
Sq Ft
$259/Sq Ft
Est. Value
About This Home
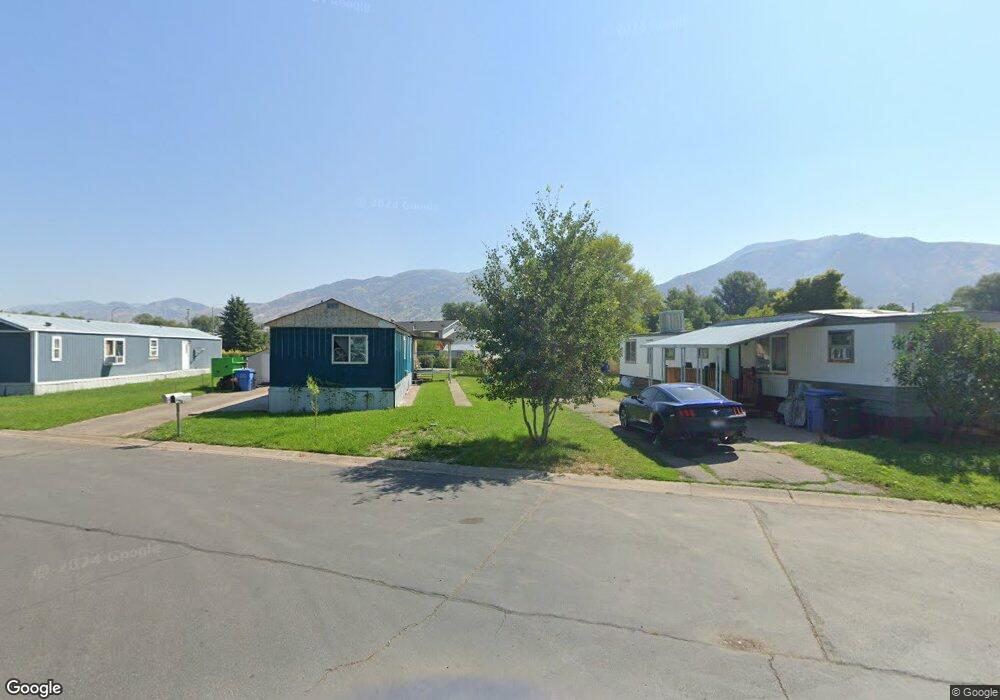
This home is located at 880 W 2650 S, Logan, UT 84321 and is currently estimated at $430,139, approximately $259 per square foot. 880 W 2650 S is a home with nearby schools including Nibley School, Spring Creek Middle School, and South Cache Middle School.
Ownership History
Date
Name
Owned For
Owner Type
Purchase Details
Closed on
Oct 6, 2014
Sold by
United States Of America
Bought by
Peck Christian S and Peck Kristen
Current Estimated Value
Home Financials for this Owner
Home Financials are based on the most recent Mortgage that was taken out on this home.
Original Mortgage
$136,800
Outstanding Balance
$104,193
Interest Rate
4.08%
Mortgage Type
USDA
Estimated Equity
$325,946
Purchase Details
Closed on
Aug 22, 2013
Sold by
Burton Casey Daniel and Burton Shayna J
Bought by
The United States Of America and Rural Housing Service
Purchase Details
Closed on
Apr 27, 2007
Sold by
Neighborhood Nonprofit Housing Corporati
Bought by
Burton Casey Daniel and Burton Shayna J
Home Financials for this Owner
Home Financials are based on the most recent Mortgage that was taken out on this home.
Original Mortgage
$150,497
Interest Rate
6.17%
Mortgage Type
Purchase Money Mortgage
Create a Home Valuation Report for This Property
The Home Valuation Report is an in-depth analysis detailing your home's value as well as a comparison with similar homes in the area
Home Values in the Area
Average Home Value in this Area
Purchase History
| Date | Buyer | Sale Price | Title Company |
|---|---|---|---|
| Peck Christian S | -- | American Secure Title | |
| The United States Of America | -- | Cache Title Logan | |
| Burton Casey Daniel | -- | Cache Title Company |
Source: Public Records
Mortgage History
| Date | Status | Borrower | Loan Amount |
|---|---|---|---|
| Open | Peck Christian S | $136,800 | |
| Previous Owner | Burton Casey Daniel | $150,497 |
Source: Public Records
Tax History
| Year | Tax Paid | Tax Assessment Tax Assessment Total Assessment is a certain percentage of the fair market value that is determined by local assessors to be the total taxable value of land and additions on the property. | Land | Improvement |
|---|---|---|---|---|
| 2025 | $168 | $223,290 | $0 | $0 |
| 2024 | $1,799 | $223,835 | $0 | $0 |
| 2023 | $2,194 | $210,900 | $0 | $0 |
| 2022 | $2,283 | $255,640 | $0 | $0 |
| 2021 | $1,695 | $294,637 | $65,000 | $229,637 |
| 2020 | $1,599 | $264,685 | $65,000 | $199,685 |
| 2019 | $1,677 | $264,684 | $65,000 | $199,684 |
| 2018 | $1,427 | $219,790 | $41,500 | $178,290 |
| 2017 | $1,425 | $116,215 | $0 | $0 |
| 2016 | $1,441 | $91,160 | $0 | $0 |
| 2015 | $1,123 | $91,160 | $0 | $0 |
| 2014 | $1,097 | $91,160 | $0 | $0 |
| 2013 | -- | $91,105 | $0 | $0 |
Source: Public Records
Map
Nearby Homes
- 2770 S 1070 West Sunset Park
- 732 W 2840 S Unit 7
- 712 W 2840 S Unit 9
- 702 W 2840 S Unit 10
- 722 W 2840 S Unit 8
- 939 Nibley Pkwy
- 2814 S 1100 W
- 2882 S 1080 W
- 2463 S 660 W
- 2680 S 600 W
- 860 W 2980 S
- 1045 W 2400 S
- 2313 S 1000 W Unit 110
- 2313 S 1000 W
- 2938 S 600 W
- 2269 Clear Creek Rd
- 1250 W 2420 S
- 1254 W 2401 S
- 2238 S 1120 W Unit 68
- 879 W 2200 S Unit 153
Your Personal Tour Guide
Ask me questions while you tour the home.