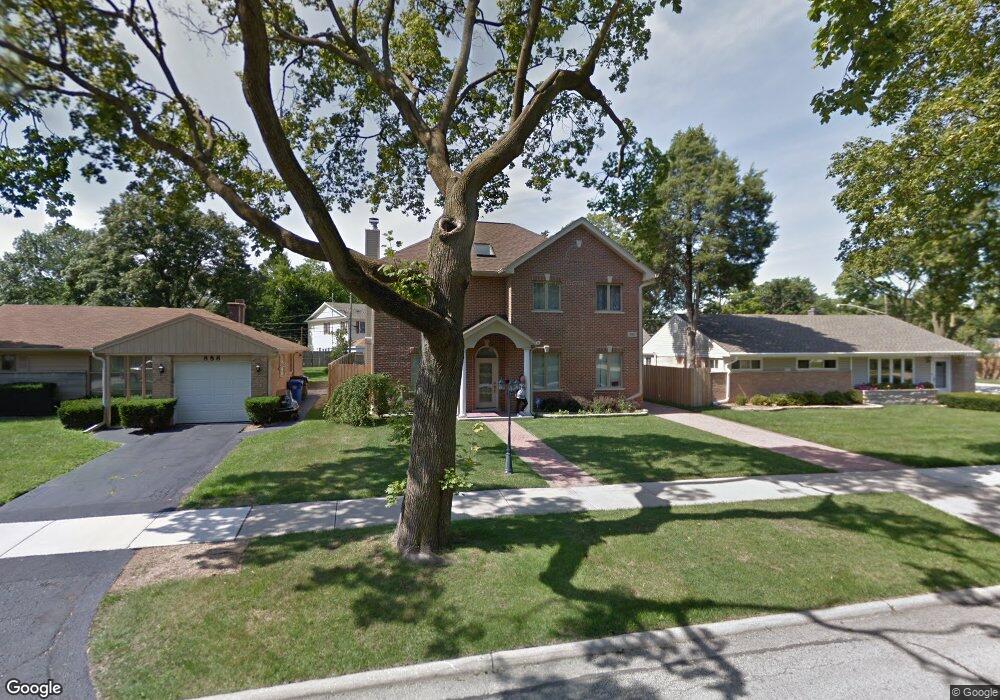
880 W Grant Dr Des Plaines, IL 60016
Estimated Value: $489,865 - $649,000
4
Beds
3
Baths
2,158
Sq Ft
$256/Sq Ft
Est. Value
About This Home
This home is located at 880 W Grant Dr, Des Plaines, IL 60016 and is currently estimated at $552,216, approximately $255 per square foot. 880 W Grant Dr is a home located in Cook County with nearby schools including Forest Elementary School, Algonquin Middle School, and Maine West High School.
Ownership History
Date
Name
Owned For
Owner Type
Purchase Details
Closed on
May 20, 2017
Sold by
Polishuk Elana Lena and Reynlib Igor
Bought by
Bahrin Maria
Current Estimated Value
Purchase Details
Closed on
Aug 12, 2010
Sold by
Us Bank National Association
Bought by
Polishuk Elana Lena
Home Financials for this Owner
Home Financials are based on the most recent Mortgage that was taken out on this home.
Original Mortgage
$286,146
Interest Rate
4.5%
Mortgage Type
FHA
Purchase Details
Closed on
Jun 1, 2010
Sold by
Kupczyk Jacek
Bought by
Us Bank National Association
Purchase Details
Closed on
Jan 7, 2004
Sold by
Rasmussen Judith L
Bought by
Kupczyk Jacek
Home Financials for this Owner
Home Financials are based on the most recent Mortgage that was taken out on this home.
Original Mortgage
$196,200
Interest Rate
4.5%
Mortgage Type
Unknown
Create a Home Valuation Report for This Property
The Home Valuation Report is an in-depth analysis detailing your home's value as well as a comparison with similar homes in the area
Home Values in the Area
Average Home Value in this Area
Purchase History
| Date | Buyer | Sale Price | Title Company |
|---|---|---|---|
| Bahrin Maria | $365,000 | None Available | |
| Polishuk Elana Lena | $290,000 | Cti | |
| Us Bank National Association | -- | None Available | |
| Kupczyk Jacek | $218,000 | Pntn |
Source: Public Records
Mortgage History
| Date | Status | Borrower | Loan Amount |
|---|---|---|---|
| Previous Owner | Polishuk Elana Lena | $286,146 | |
| Previous Owner | Kupczyk Jacek | $196,200 |
Source: Public Records
Tax History Compared to Growth
Tax History
| Year | Tax Paid | Tax Assessment Tax Assessment Total Assessment is a certain percentage of the fair market value that is determined by local assessors to be the total taxable value of land and additions on the property. | Land | Improvement |
|---|---|---|---|---|
| 2024 | $9,145 | $38,000 | $5,259 | $32,741 |
| 2023 | $8,898 | $38,000 | $5,259 | $32,741 |
| 2022 | $8,898 | $38,000 | $5,259 | $32,741 |
| 2021 | $10,210 | $33,215 | $4,382 | $28,833 |
| 2020 | $10,037 | $33,215 | $4,382 | $28,833 |
| 2019 | $10,044 | $37,321 | $4,382 | $32,939 |
| 2018 | $8,565 | $28,639 | $3,856 | $24,783 |
| 2017 | $7,422 | $28,639 | $3,856 | $24,783 |
| 2016 | $7,264 | $28,639 | $3,856 | $24,783 |
| 2015 | $6,881 | $25,384 | $3,330 | $22,054 |
| 2014 | $6,752 | $25,384 | $3,330 | $22,054 |
| 2013 | $6,566 | $25,384 | $3,330 | $22,054 |
Source: Public Records
Map
Nearby Homes
- 714 E Thacker St
- 911 E Villa Dr
- 858 E Grant Dr
- 906 Alfini Dr
- 881 E Thacker St
- 1056 E Villa Dr
- 520 E Thacker St
- 886 E Thacker St
- 1157 W Grant Dr
- 434 E Thacker St
- 508 Crestwood Dr
- 1205 S Wolf Rd
- 514 S 4th Ave
- 879 North Ave
- 648 1st Ave
- 890 North Ave
- 1057 Hollywood Ave
- 915 Graceland Ave Unit 1E
- 1394 Carol Ln
- 474 E Washington St