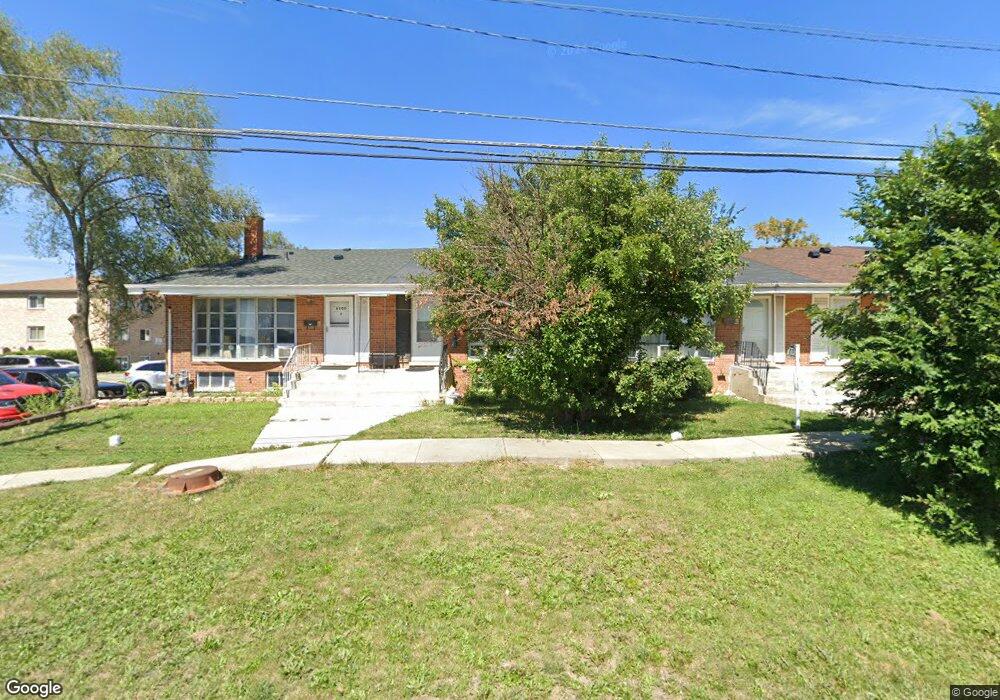
8800 Robin Dr Des Plaines, IL 60016
Estimated Value: $245,074 - $301,000
2
Beds
2
Baths
1,127
Sq Ft
$232/Sq Ft
Est. Value
About This Home
This home is located at 8800 Robin Dr, Des Plaines, IL 60016 and is currently estimated at $262,019, approximately $232 per square foot. 8800 Robin Dr is a home located in Cook County with nearby schools including Apollo Elementary School, Gemini Middle School, and Maine East High School.
Ownership History
Date
Name
Owned For
Owner Type
Purchase Details
Closed on
May 20, 2002
Sold by
Lipnicki Bozena and Lipnicki Miroslaw
Bought by
Desai Salim and Desai Julekha
Current Estimated Value
Home Financials for this Owner
Home Financials are based on the most recent Mortgage that was taken out on this home.
Original Mortgage
$120,000
Outstanding Balance
$49,163
Interest Rate
6.93%
Estimated Equity
$212,856
Purchase Details
Closed on
Feb 28, 2000
Sold by
Sayman Sirous P and Sayman Josephine G
Bought by
Lipnicki Bozena
Home Financials for this Owner
Home Financials are based on the most recent Mortgage that was taken out on this home.
Original Mortgage
$98,400
Interest Rate
10.12%
Purchase Details
Closed on
Apr 30, 1997
Sold by
Eliah Gelbert Y and Eliah Susan
Bought by
Sayman Sirous and Sayman Josephine G
Home Financials for this Owner
Home Financials are based on the most recent Mortgage that was taken out on this home.
Original Mortgage
$101,650
Interest Rate
8.27%
Create a Home Valuation Report for This Property
The Home Valuation Report is an in-depth analysis detailing your home's value as well as a comparison with similar homes in the area
Home Values in the Area
Average Home Value in this Area
Purchase History
| Date | Buyer | Sale Price | Title Company |
|---|---|---|---|
| Desai Salim | $168,000 | Lawyers Title Insurance Corp | |
| Lipnicki Bozena | $123,000 | Professional National Title | |
| Sayman Sirous | $107,000 | Attorneys Natl Title Network |
Source: Public Records
Mortgage History
| Date | Status | Borrower | Loan Amount |
|---|---|---|---|
| Open | Desai Salim | $120,000 | |
| Previous Owner | Lipnicki Bozena | $98,400 | |
| Previous Owner | Sayman Sirous | $101,650 | |
| Closed | Lipnicki Bozena | $24,600 |
Source: Public Records
Tax History
| Year | Tax Paid | Tax Assessment Tax Assessment Total Assessment is a certain percentage of the fair market value that is determined by local assessors to be the total taxable value of land and additions on the property. | Land | Improvement |
|---|---|---|---|---|
| 2025 | $4,793 | $19,000 | $2,983 | $16,017 |
| 2024 | $4,793 | $21,000 | $3,500 | $17,500 |
| 2023 | $4,531 | $21,000 | $3,500 | $17,500 |
| 2022 | $4,531 | $21,000 | $3,500 | $17,500 |
| 2021 | $4,395 | $17,327 | $1,657 | $15,670 |
| 2020 | $4,363 | $17,327 | $1,657 | $15,670 |
| 2019 | $4,015 | $18,308 | $1,657 | $16,651 |
| 2018 | $3,681 | $15,404 | $1,449 | $13,955 |
| 2017 | $3,648 | $15,404 | $1,449 | $13,955 |
| 2016 | $3,653 | $15,404 | $1,449 | $13,955 |
| 2015 | $3,140 | $12,782 | $1,242 | $11,540 |
| 2014 | $3,047 | $12,782 | $1,242 | $11,540 |
| 2013 | $3,304 | $13,889 | $1,242 | $12,647 |
Source: Public Records
Map
Nearby Homes
- 8807 Dee Rd
- 8810 Briar Ct Unit 1B
- 8802 Briar Ct Unit 3A
- 1913 Rancho Ln
- 9342 Landings Ln Unit 504
- 9332 Landings Ln Unit 504
- 9377 Landings Ln Unit 507
- 9355 Landings Ln Unit 406
- 9395 Landings Ln Unit 405
- 2000 Parkside Dr Unit FG
- 9396 Landings Ln Unit 306
- 9396 Landings Ln Unit 202
- 9396 Landings Ln Unit 501
- 9396 Landings Ln Unit 504
- 9396 Landings Ln Unit 207
- 2818 Farrell Ave
- 9208 Bumble Bee Dr Unit 2D
- 1745 Pavilion Way Unit 502
- 1745 Pavilion Way Unit 206
- 1715 Pavilion Way Unit 206
- 8800 Robin Dr Unit E
- 8800 Robin Dr Unit A
- 8800 Robin Dr
- 8800 Robin Dr
- 8800 Robin Dr
- 8800 Robin Dr
- 8800 Robin Dr
- 8800 Robin Dr Unit D
- 8800 Robin Dr Unit B
- 8810 Robin Dr
- 8810 Robin Dr
- 8810 Robin Dr
- 8810 Robin Dr
- 8810 Robin Dr
- 8810 Robin Dr
- 8810 Robin Dr Unit C
- 8810 Robin Dr Unit D
- 8802 Robin Dr
- 8804 Robin Dr
- 8806 Robin Dr
Your Personal Tour Guide
Ask me questions while you tour the home.