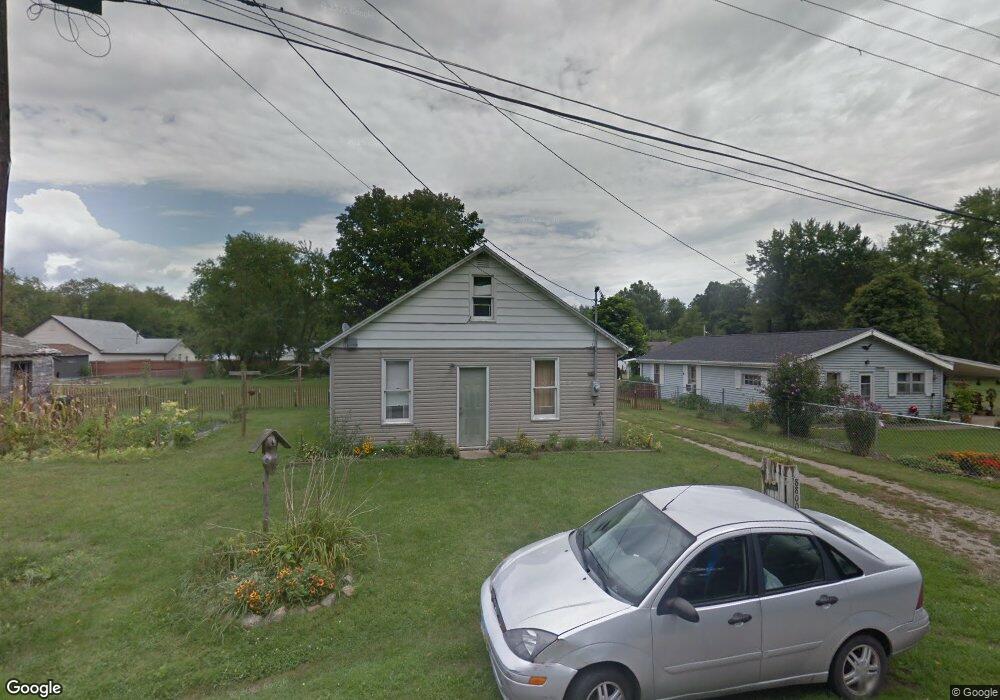
8800 Sequoia Ave SE Waynesburg, OH 44688
Estimated Value: $109,951 - $136,000
3
Beds
1
Bath
1,000
Sq Ft
$119/Sq Ft
Est. Value
About This Home
This home is located at 8800 Sequoia Ave SE, Waynesburg, OH 44688 and is currently estimated at $119,238, approximately $119 per square foot. 8800 Sequoia Ave SE is a home located in Stark County with nearby schools including Sandy Valley Elementary School, Sandy Valley Middle School, and Sandy Valley High School.
Ownership History
Date
Name
Owned For
Owner Type
Purchase Details
Closed on
May 3, 2013
Sold by
Husk Ronnie P
Bought by
Husk Jennifer N and Shaw Ii Danny L
Current Estimated Value
Home Financials for this Owner
Home Financials are based on the most recent Mortgage that was taken out on this home.
Original Mortgage
$51,000
Outstanding Balance
$11,130
Interest Rate
3.51%
Mortgage Type
FHA
Estimated Equity
$108,108
Purchase Details
Closed on
Apr 2, 2007
Sold by
Husk Brenda R and Husk Ronnie P
Bought by
Husk Ii Ronnie P
Home Financials for this Owner
Home Financials are based on the most recent Mortgage that was taken out on this home.
Original Mortgage
$50,000
Interest Rate
6.31%
Mortgage Type
Stand Alone Refi Refinance Of Original Loan
Purchase Details
Closed on
Mar 29, 2007
Sold by
Huffman Timothy W and Huffman Kimberly
Bought by
Husk Brenda R
Home Financials for this Owner
Home Financials are based on the most recent Mortgage that was taken out on this home.
Original Mortgage
$50,000
Interest Rate
6.31%
Mortgage Type
Stand Alone Refi Refinance Of Original Loan
Purchase Details
Closed on
Dec 4, 2006
Sold by
Huffman Timothy W
Bought by
Husk Brenda R
Purchase Details
Closed on
Oct 25, 2006
Sold by
Boggs George T and Boggs William R
Bought by
Huffman Timothy W
Create a Home Valuation Report for This Property
The Home Valuation Report is an in-depth analysis detailing your home's value as well as a comparison with similar homes in the area
Home Values in the Area
Average Home Value in this Area
Purchase History
| Date | Buyer | Sale Price | Title Company |
|---|---|---|---|
| Husk Jennifer N | $60,000 | None Available | |
| Husk Ii Ronnie P | $71,500 | Attorney | |
| Husk Brenda R | -- | None Available | |
| Husk Brenda R | -- | None Available | |
| Huffman Timothy W | $6,048 | None Available |
Source: Public Records
Mortgage History
| Date | Status | Borrower | Loan Amount |
|---|---|---|---|
| Open | Husk Jennifer N | $51,000 | |
| Closed | Husk Ii Ronnie P | $50,000 |
Source: Public Records
Tax History Compared to Growth
Tax History
| Year | Tax Paid | Tax Assessment Tax Assessment Total Assessment is a certain percentage of the fair market value that is determined by local assessors to be the total taxable value of land and additions on the property. | Land | Improvement |
|---|---|---|---|---|
| 2025 | $469 | $19,920 | $4,450 | $15,470 |
| 2024 | $382 | $19,920 | $4,450 | $15,470 |
| 2023 | $729 | $15,970 | $1,720 | $14,250 |
| 2022 | $706 | $15,970 | $1,720 | $14,250 |
| 2021 | $706 | $15,970 | $1,720 | $14,250 |
| 2020 | $614 | $13,550 | $1,470 | $12,080 |
| 2019 | $593 | $13,550 | $1,470 | $12,080 |
| 2018 | $595 | $13,550 | $1,470 | $12,080 |
| 2017 | $522 | $11,210 | $1,650 | $9,560 |
| 2016 | $526 | $11,210 | $1,650 | $9,560 |
| 2015 | $531 | $11,210 | $1,650 | $9,560 |
| 2014 | $511 | $10,650 | $1,580 | $9,070 |
| 2013 | $259 | $10,650 | $1,580 | $9,070 |
Source: Public Records
Map
Nearby Homes
- 7796 Mottice Dr SE
- 177 W Lisbon St
- 7803 Elson St SE
- 7750 Waynesburg Dr SE
- 7678 Waynesburg Dr SE
- 715 Minerva Rd
- 614 Levee Cir
- 5488 Elson St SE
- 6805 Waynesburg Dr SE
- 217 E Carrollton St
- 3799 Westbrook St SE
- 9144 Malwayne Dr NW
- 7009 Bachelor Rd NW
- 7145 Bluebird Rd NW
- 121 W Mohawk Dr
- 158 W Mohawk Dr
- 7227 Maple St NW Unit 19A
- 8522 Cleveland Ave SE
- 7901 E Sparta Ave
- 6 Cayuga Trail
- 8810 Sequoia Ave SE
- 8780 Sequoia Ave SE
- 8770 Sequoia Ave SE
- 8825 Elmfort Ave SE
- 8825 Elmfort Ave SE
- 8793 Elmfort Ave SE
- 373 Broadford St SE
- 8787 Elmfort Ave SE
- 7487 Broadford St SE
- 8756 Sequoia Ave SE
- 8814 Elmfort Ave SE
- 8814 Elmfort Ave SE
- 8784 Elmfort Ave SE
- 7494 Broadford St SE
- 8709 Elmfort Ave SE
- 7539 Grovedell St SE
- 8746 Elmfort Ave SE
- 8815 Mapledale Dr SE
- 8825 Mapledale Dr SE
- 8807 Mapledale Dr SE