NOT LISTED FOR SALE

8801 N Nc Highway 109 Winston Salem, NC 27107

Estimated Value: $430,000 - $701,000

4 Beds
3 Baths
4,332 Sq Ft
$139/Sq Ft Est. Value

Last Sold October 14, 2016

Last sale price $185,000 $43 Per Sq Ft

Est. 226% increase in value since last sale

Current estimated payment $3,168/month

About This Home

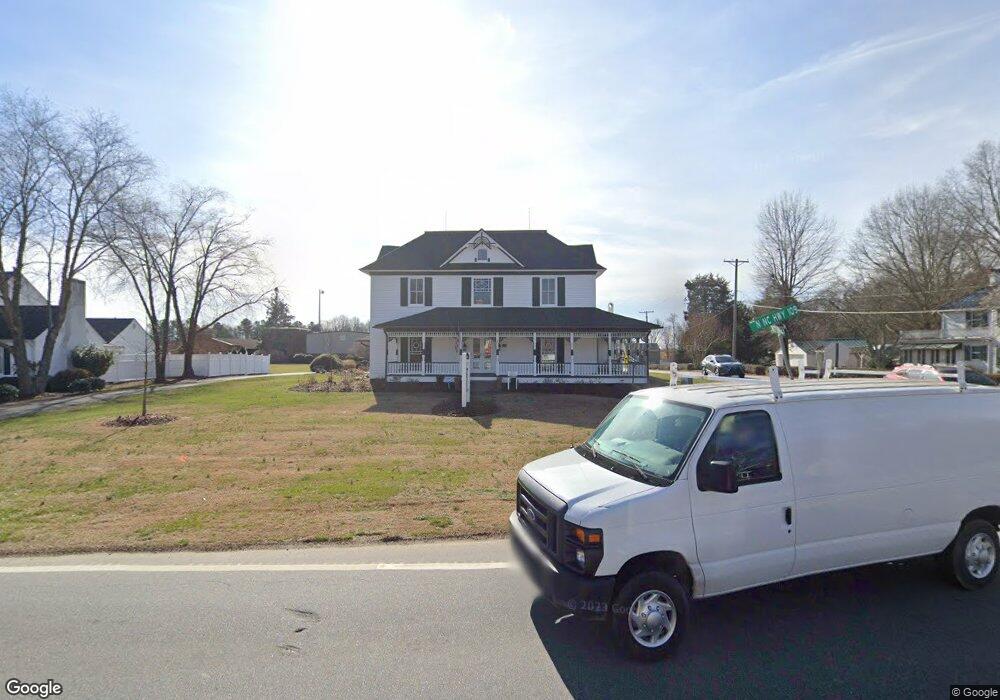
Very historic unique property that has a total of 10 rooms 4 which is bedrooms and 2.5 baths with original hardwood flooring and great ancient character features. Property is being sold in an As-Is state. Terms have been accepted , waiting on seller's signature . NO BACK UP OFFERS.

Ownership History

Date Name Owned For Owner Type

Purchase Details

Listed on
Sep 20, 2016
Closed on
Oct 14, 2016
Sold by
Federal National Mortgage Association
Bought by
Town Of Wallburg
Seller's Agent
Mike Headley
The Headley Group Realty
Buyer's Agent
Mike Headley
The Headley Group Realty
List Price
$185,000
Sold Price
$185,000
Current Estimated Value
$602,259

Home Financials for this Owner

Home Financials are based on the most recent Mortgage that was taken out on this home.
Estimated Appreciation
$417,259
Avg. Annual Appreciation
13.95%

Purchase Details

Closed on
Dec 9, 2005
Sold by
Hyde Roy Anthony and Hyde Barbara S
Bought by
Workman Victor S and Lockerman James W

Purchase Details

Closed on
Nov 16, 1999
Sold by
Maness Iii Jiles G
Bought by
Hyde Roy Anthony

Purchase Details

Closed on
Jul 1, 1991
Source: Public Records

Range of Values:

Collateral Analytics

Collateral Analytics Collateral Analytics AVMs (Automated Valuation Model) employ a number of statistical approaches combined with neighborhood-specific comparable selection guarantees the most up-to-date and precise valuations.

Not Available

Collateral Analytics does not have data for the current month. Please view the chart for historical values.

ICE

ICE Mortgage Technology ICE Mortgage Technology’s AVM (Automated Valuation Model) is a state-of-the-art online residential property valuation tool that provides a quick and accurate estimate of the value of almost any home in the U.S.

Not Available

ICE Mortgage Technology does not have data for the current month. Please view the chart for historical values.

First American

First American First American Data & Analytics’ next-generation AVM combines unrivaled data assets with a blended ensemble of valuation models to produce highly accurate, reliable valuations you can trust.

Not Available

First American does not have data for the current month. Please view the chart for historical values.

Quantarium

Quantarium Quantarium’s valuation service, repeatedly proven the industry’s most accurate and comprehensive, is supercharged with a self-learning and auto-tuning AI engine that continually becomes smarter and more accurate as it processes daily inputs from the industry’s leading RE data lake.

Not Available

Quantarium does not have data for the current month. Please view the chart for historical values.

Average Value
Not Available
List Price
Sold Price
Create a Home Valuation Report for This Property
The Home Valuation Report is an in-depth analysis detailing your home's value as well as a comparison with similar homes in the area

Home Values in the Area

Source: Public Records

Average Home Value in this Area


Source: Public Records

Purchase History

Date Buyer Sale Price Title Company
Town Of Wallburg $185,000 None Available
Workman Victor S $440,000 None Available
Hyde Roy Anthony $200,000 --
-- $175,000 --
Source: Public Records

Property History

Date Event Price List to Sale Price per Sq Ft Prior Sale
10/14/2016 10/14/16 Sold $185,000 0.0% $49 / Sq Ft View Prior Sale
09/29/2016 09/29/16 Pending -- -- --
09/20/2016 09/20/16 For Sale $185,000 -- $49 / Sq Ft

Tax History Compared to Growth

Source: Public Records

Tax History

Year Tax Paid Tax Assessment Tax Assessment Total Assessment is a certain percentage of the fair market value that is determined by local assessors to be the total taxable value of land and additions on the property. Land Improvement
2025 -- $532,140 $0 $0
2024 -- $515,330 $0 $0
2023 $0 $515,330 $0 $0
2022 $3,104 $515,330 $0 $0
2021 $3,104 $515,330 $0 $0
2020 -- $456,560 $0 $0
2019 $3,104 $456,560 $0 $0
2018 $3,104 $456,560 $0 $0
2017 $3,104 $456,560 $0 $0
2016 $3,151 $456,730 $0 $0
2015 $3,151 $456,730 $0 $0
2014 $3,232 $468,420 $0 $0
Source: Public Records

Agents Affiliated with this Home

  • Section Image
See All Agents

Map