M
Seller's Agent in 2019
Mark Dimas
Mark Dimas Team

Estimated Value: $272,079 - $292,000
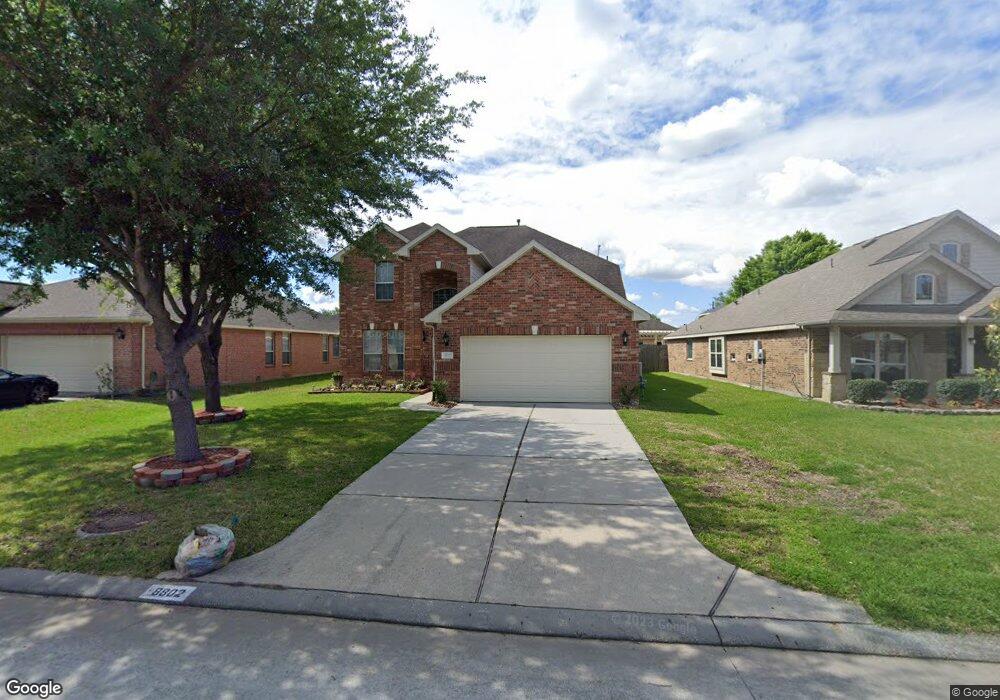
Beautiful two story home with 4 bedrooms, 2.5 baths, a 2-car attached garage, and excellent curb appeal! Features include a shaded front porch, lovely archways, a grand foyer, tile flooring in the main areas, a living room with a fireplace, and a formal dining. The eat-in kitchen has granite counter tops, ample cabinet space, and a walk-in pantry while the master suite is also downstairs with dual sinks, a separate shower, and whirlpool tub! Upstairs you'll find the game room, secondary bedrooms, and a full bath. There's a large backyard with a covered patio, and easy access to FM 1960, I-69, and Deerbrook Mall!
Last Agent to Sell the Property
Mark Dimas
Mark Dimas Team Listed on: 06/03/2019
| Date | Buyer | Sale Price | Title Company |
|---|---|---|---|
| Wilkins Anita A | -- | Fidelity National Title | |
| Sph Property One Llc | -- | Fidelity National Title | |
| Labatia Sherif Y | -- | North American Title Co | |
| Lennar Homes Of Texas Sales & Mktg Ltd | -- | North American Title Co |
| Date | Status | Borrower | Loan Amount |
|---|---|---|---|
| Open | Wilkins Anita A | $158,400 | |
| Previous Owner | Labatia Sherif Y | $175,990 |
| Date | Event | Price | List to Sale | Price per Sq Ft |
|---|---|---|---|---|
| 08/25/2024 08/25/24 | Off Market | -- | -- | -- |
| 09/24/2019 09/24/19 | Sold | -- | -- | -- |
| 08/25/2019 08/25/19 | Pending | -- | -- | -- |
| 06/03/2019 06/03/19 | For Sale | $219,900 | 0.0% | $78 / Sq Ft |
| 01/08/2016 01/08/16 | Rented | $1,750 | 0.0% | -- |
| 01/08/2016 01/08/16 | For Rent | $1,750 | -- | -- |
| Year | Tax Paid | Tax Assessment Tax Assessment Total Assessment is a certain percentage of the fair market value that is determined by local assessors to be the total taxable value of land and additions on the property. | Land | Improvement |
|---|---|---|---|---|
| 2025 | $5,477 | $274,020 | $41,092 | $232,928 |
| 2024 | $5,477 | $276,968 | $41,092 | $235,876 |
| 2023 | $5,477 | $307,155 | $41,092 | $266,063 |
| 2022 | $6,673 | $271,950 | $29,352 | $242,598 |
| 2021 | $6,333 | $230,858 | $29,352 | $201,506 |
| 2020 | $6,132 | $212,448 | $29,352 | $183,096 |
| 2019 | $6,051 | $201,382 | $29,352 | $172,030 |
| 2018 | $2,643 | $184,043 | $29,352 | $154,691 |
| 2017 | $5,404 | $184,043 | $29,352 | $154,691 |
| 2016 | $5,404 | $184,043 | $29,352 | $154,691 |
| 2015 | $4,839 | $171,101 | $29,352 | $141,749 |
| 2014 | $4,839 | $162,757 | $29,352 | $133,405 |
M
Seller's Agent in 2019
Mark Dimas
Mark Dimas Team
P
Buyer's Agent in 2019
Pat Nemec
Pat Nemec Realty
(281) 413-1496
1 in this area
42 Total Sales
L
Seller's Agent in 2016
Linda Grover
Sterling Real Estate Group
1 in this area
33 Total Sales
G
Buyer's Agent in 2016
Gary Wells
Real Property Management Prefe
Source: Houston Association of REALTORS®
MLS Number: 3861551
APN: 1277390050010
Disclaimer: Certain information contained herein is derived from information provided by parties other than Homes.com. All information provided is deemed reliable, but is not guaranteed to be accurate and should be independently verified.
![]() Copyright 2026, Houston REALTORS® Information Service, Inc.
Copyright 2026, Houston REALTORS® Information Service, Inc.
The information provided is exclusively for consumers’ personal, non-commercial use, and may not be used for any purpose other than to identify prospective properties consumers may be interested in purchasing.
Information is deemed reliable but not guaranteed.
Ask me questions while you tour the home.
