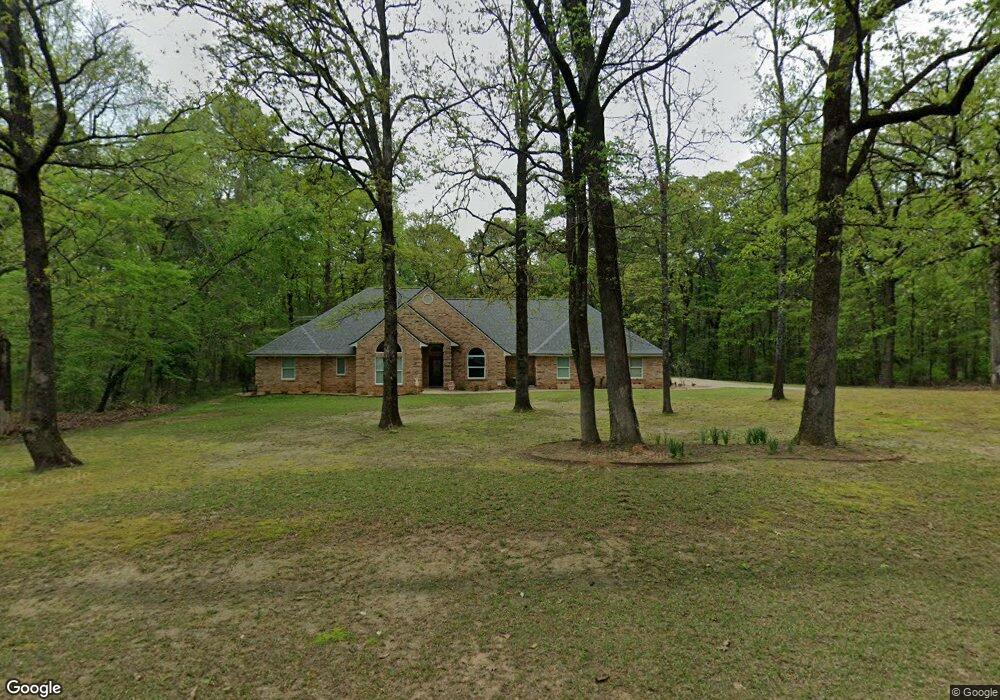
8802 Tigres Ave Texarkana, TX 75503
Estimated Value: $415,666 - $551,000
--
Bed
--
Bath
2,541
Sq Ft
$190/Sq Ft
Est. Value
About This Home
This home is located at 8802 Tigres Ave, Texarkana, TX 75503 and is currently estimated at $482,417, approximately $189 per square foot. 8802 Tigres Ave is a home located in Bowie County with nearby schools including Red Lick Elementary School, Red Lick Middle School, and Texarkana Sda School.
Ownership History
Date
Name
Owned For
Owner Type
Purchase Details
Closed on
Nov 20, 2024
Sold by
Friday Micah and Friday Elizabeth
Bought by
Potts Christopher and Potts Hollan
Current Estimated Value
Home Financials for this Owner
Home Financials are based on the most recent Mortgage that was taken out on this home.
Original Mortgage
$148,000
Outstanding Balance
$146,435
Interest Rate
6.32%
Mortgage Type
New Conventional
Estimated Equity
$335,982
Purchase Details
Closed on
Nov 1, 2022
Sold by
Friday Susan
Bought by
Friday Micah and Friday Elizabeth
Home Financials for this Owner
Home Financials are based on the most recent Mortgage that was taken out on this home.
Original Mortgage
$235,000
Interest Rate
6.7%
Mortgage Type
New Conventional
Purchase Details
Closed on
Aug 26, 2022
Sold by
Allen Mcguire Carter and Lynn Keri
Bought by
Friday Susan
Purchase Details
Closed on
May 25, 2018
Sold by
Cramer Phillip C and Cramer Kala Renee
Bought by
Mcguire Carter Allen and Mcguire Keri Lynn
Home Financials for this Owner
Home Financials are based on the most recent Mortgage that was taken out on this home.
Original Mortgage
$189,975
Interest Rate
4.4%
Mortgage Type
Balloon
Create a Home Valuation Report for This Property
The Home Valuation Report is an in-depth analysis detailing your home's value as well as a comparison with similar homes in the area
Home Values in the Area
Average Home Value in this Area
Purchase History
| Date | Buyer | Sale Price | Title Company |
|---|---|---|---|
| Potts Christopher | -- | None Listed On Document | |
| Friday Micah | $235,000 | None Listed On Document | |
| Friday Susan | -- | -- | |
| Mcguire Carter Allen | -- | Twin City Title |
Source: Public Records
Mortgage History
| Date | Status | Borrower | Loan Amount |
|---|---|---|---|
| Open | Potts Christopher | $148,000 | |
| Previous Owner | Friday Micah | $235,000 | |
| Previous Owner | Mcguire Carter Allen | $189,975 |
Source: Public Records
Tax History Compared to Growth
Tax History
| Year | Tax Paid | Tax Assessment Tax Assessment Total Assessment is a certain percentage of the fair market value that is determined by local assessors to be the total taxable value of land and additions on the property. | Land | Improvement |
|---|---|---|---|---|
| 2025 | $5,515 | $422,878 | $70,050 | $352,828 |
| 2024 | $5,515 | $421,517 | $70,050 | $351,467 |
| 2023 | $6,619 | $402,215 | $70,050 | $332,165 |
| 2022 | $5,974 | $367,785 | $70,050 | $297,735 |
| 2021 | $5,690 | $322,998 | $70,050 | $252,948 |
| 2020 | $5,543 | $311,339 | $70,050 | $241,289 |
| 2019 | $5,526 | $300,243 | $70,050 | $230,193 |
| 2018 | $5,369 | $291,700 | $70,050 | $221,650 |
| 2017 | $5,249 | $287,519 | $70,050 | $217,469 |
| 2016 | $5,138 | $281,415 | $70,050 | $211,365 |
| 2015 | $4,370 | $278,435 | $70,050 | $208,385 |
| 2014 | $4,370 | $272,578 | $70,050 | $202,528 |
Source: Public Records
Map
Nearby Homes
- 8204 Thames Cir
- 7012 Cameron
- 7008 Cameron
- 8112 Gadwall Trail
- 6810 Kincaid St
- 6803 Kincaid St
- 6714 Lawson Cir
- 8109 Gadwall Trail
- 8102 Gadwall Trail
- 6706 Cameron
- 8210 Teal Rd
- 8203 Teal Rd
- 8204 Teal Rd
- 8414 Mandarin Cove
- 8405 Mandarin Cove
- 8308 Greenhead Dr
- 8905 River Ridge Dr
- 8304 Greenhead Dr
- 8227 N Kings Hwy
- 14 Stonewall Trace
- 8902 Tigres Ave
- 8702 Tigres Ave
- 8601 Tigres Ave
- 8701 Tigres Ave
- 9000 Tigres Ave
- 7000 Volga Ave
- 8801 Tigres Ave
- 8501 Tigres Ave
- 8602 Tigres Ave
- 8901 Tigres Ave
- 7704 Volga Ave
- 7706 Volga Ave
- 8401 Tigres Ave
- 8502 Tigres Ave
- 2.23 Acres Volga Ave
- 7708 Volga Ave
- 8602 Yukon Ave
- 1120 County Road 2310
- 8500 Tigres Ave
- 8502 Yukon Ave