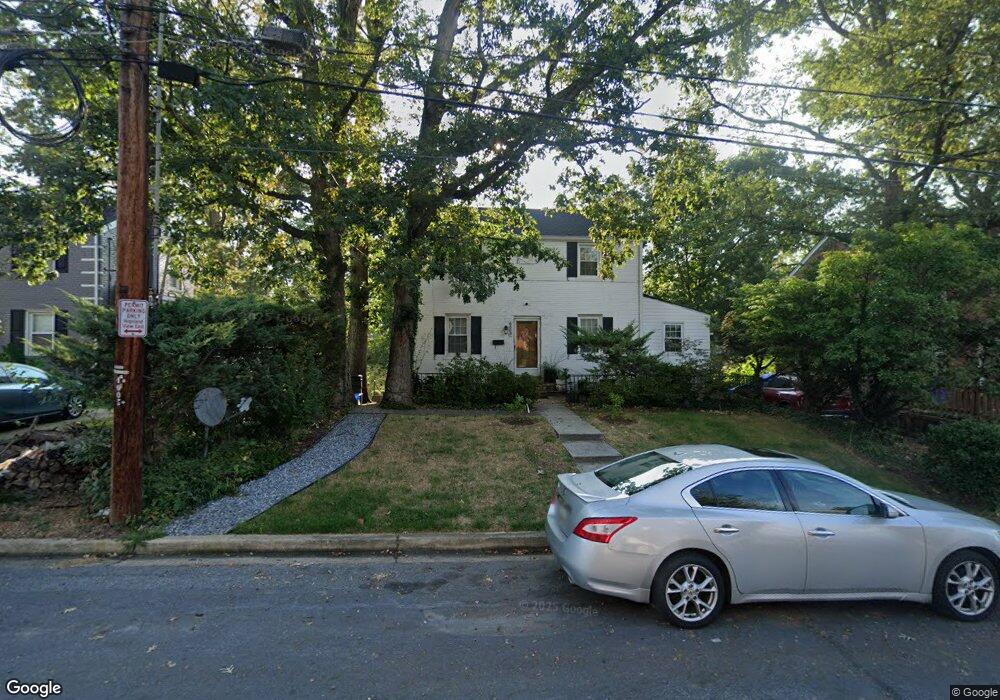
8803 Bradford Rd Silver Spring, MD 20901
Silver Spring Park NeighborhoodEstimated Value: $493,972 - $619,000
Studio
2
Baths
1,356
Sq Ft
$420/Sq Ft
Est. Value
About This Home
This home is located at 8803 Bradford Rd, Silver Spring, MD 20901 and is currently estimated at $569,743, approximately $420 per square foot. 8803 Bradford Rd is a home located in Montgomery County with nearby schools including New Hampshire Estates Elementary School, Oak View Elementary School, and Eastern Middle School.
Ownership History
Date
Name
Owned For
Owner Type
Purchase Details
Closed on
Oct 3, 2025
Sold by
Rivas-Garcia Beverlyn and Rivas Beverlyn
Bought by
Beverlyn Rivas-Garcia Revocable Trust and Rivas-Garcia
Current Estimated Value
Purchase Details
Closed on
Mar 14, 2016
Sold by
Rivas Beverlyn and Rivas Melvin
Bought by
Rivas Beverlyn
Home Financials for this Owner
Home Financials are based on the most recent Mortgage that was taken out on this home.
Original Mortgage
$89,000
Interest Rate
3.65%
Mortgage Type
New Conventional
Purchase Details
Closed on
Mar 21, 1994
Sold by
Household Fin Cp Iii
Bought by
Rivas Melvin
Home Financials for this Owner
Home Financials are based on the most recent Mortgage that was taken out on this home.
Original Mortgage
$123,400
Interest Rate
6.9%
Purchase Details
Closed on
Oct 12, 1993
Sold by
Fraser Jenkins R L
Bought by
Household Fin Corp
Create a Home Valuation Report for This Property
The Home Valuation Report is an in-depth analysis detailing your home's value as well as a comparison with similar homes in the area
Home Values in the Area
Average Home Value in this Area
Purchase History
| Date | Buyer | Sale Price | Title Company |
|---|---|---|---|
| Beverlyn Rivas-Garcia Revocable Trust | -- | None Listed On Document | |
| Rivas Beverlyn | $62,308 | Certified Title Corporation | |
| Rivas Melvin | $129,900 | -- | |
| Household Fin Corp | $106,500 | -- |
Source: Public Records
Mortgage History
| Date | Status | Borrower | Loan Amount |
|---|---|---|---|
| Previous Owner | Rivas Beverlyn | $89,000 | |
| Previous Owner | Household Fin Corp | $123,400 |
Source: Public Records
Tax History
| Year | Tax Paid | Tax Assessment Tax Assessment Total Assessment is a certain percentage of the fair market value that is determined by local assessors to be the total taxable value of land and additions on the property. | Land | Improvement |
|---|---|---|---|---|
| 2025 | $5,603 | $453,800 | -- | -- |
| 2024 | $5,603 | $429,100 | $251,100 | $178,000 |
| 2023 | $4,794 | $420,600 | $0 | $0 |
| 2022 | $3,322 | $412,100 | $0 | $0 |
| 2021 | $4,249 | $403,600 | $251,100 | $152,500 |
| 2020 | $4,035 | $383,133 | $0 | $0 |
| 2019 | $3,776 | $362,667 | $0 | $0 |
| 2018 | $3,525 | $342,200 | $216,100 | $126,100 |
| 2017 | $3,502 | $335,133 | $0 | $0 |
| 2016 | -- | $328,067 | $0 | $0 |
| 2015 | $2,959 | $321,000 | $0 | $0 |
| 2014 | $2,959 | $321,000 | $0 | $0 |
Source: Public Records
Map
Nearby Homes
- 8712 Geren Rd
- 8705 Bradford Rd
- 8601 Manchester Rd Unit 220
- 8601 Manchester Rd Unit 310
- 8511 Flower Ave
- 8509 Flower Ave
- 2 Dale Dr
- 417 Mansfield Rd
- 8 Melbourne Ave
- 9039 Sligo Creek Pkwy Unit 1409
- 9039 Sligo Creek Pkwy Unit 205
- 9039 Sligo Creek Pkwy Unit 809
- 9039 Sligo Creek Pkwy Unit 606
- 8817 Glenville Rd
- 500 Thayer Ave Unit 504
- 9217 Three Oaks Dr
- 9201 Three Oaks Dr
- 8209 Flower Ave
- 805 Langley Dr
- 9214 Three Oaks Dr
- 8805 Bradford Rd
- 8801 Bradford Rd
- 8804 Reading Rd
- 8800 Reading Rd
- 8807 Bradford Rd
- 8806 Reading Rd
- 8800 Bradford Rd
- 8802 Bradford Rd Unit 5
- 8802 Bradford Rd Unit 4
- 8802 Bradford Rd
- 8804 Bradford Rd Unit 2
- 8804 Bradford Rd Unit 5
- 8804 Bradford Rd
- 200 Hartwell Rd
- 8809 Bradford Rd
- 8808 Reading Rd
- 8806 Bradford Rd
- 8806 Bradford Rd Unit 2
- 8718 Reading Rd
- 8719 Bradford Rd
Your Personal Tour Guide
Ask me questions while you tour the home.