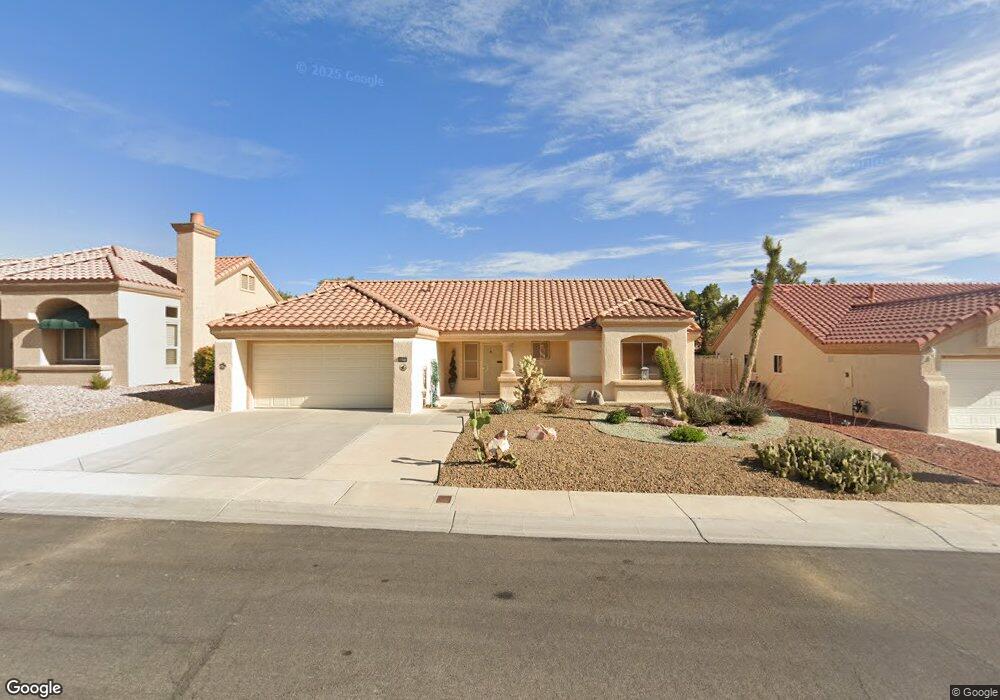
8804 Stoney Point Dr Las Vegas, NV 89134
Sun City Summerlin NeighborhoodEstimated Value: $397,902 - $437,000
2
Beds
2
Baths
1,172
Sq Ft
$359/Sq Ft
Est. Value
About This Home
This home is located at 8804 Stoney Point Dr, Las Vegas, NV 89134 and is currently estimated at $420,226, approximately $358 per square foot. 8804 Stoney Point Dr is a home located in Clark County with nearby schools including William Lummis Elementary School, Ernest Becker Middle School, and Palo Verde High School.
Ownership History
Date
Name
Owned For
Owner Type
Purchase Details
Closed on
Dec 1, 2017
Sold by
Stevens Donna
Bought by
Stevens Donna and The Donna Stevens Revocable Living Trust
Current Estimated Value
Purchase Details
Closed on
Oct 28, 2013
Sold by
Alpers Barbara H
Bought by
Stevens Donna
Home Financials for this Owner
Home Financials are based on the most recent Mortgage that was taken out on this home.
Original Mortgage
$75,000
Outstanding Balance
$56,438
Interest Rate
4.46%
Mortgage Type
New Conventional
Estimated Equity
$363,788
Purchase Details
Closed on
Apr 12, 2002
Sold by
Alpers Barbara H
Bought by
Alpers Barbara H and Barbara H Alpers Trust
Purchase Details
Closed on
May 30, 2001
Sold by
Krustulovich Suzanne M
Bought by
Alpers Carl and Alpers Barbara
Home Financials for this Owner
Home Financials are based on the most recent Mortgage that was taken out on this home.
Original Mortgage
$81,000
Interest Rate
7.15%
Create a Home Valuation Report for This Property
The Home Valuation Report is an in-depth analysis detailing your home's value as well as a comparison with similar homes in the area
Home Values in the Area
Average Home Value in this Area
Purchase History
| Date | Buyer | Sale Price | Title Company |
|---|---|---|---|
| Stevens Donna | -- | None Available | |
| Stevens Donna | $175,000 | Fidelity National Title | |
| Alpers Barbara H | -- | -- | |
| Alpers Carl | $141,000 | Fidelity National Title |
Source: Public Records
Mortgage History
| Date | Status | Borrower | Loan Amount |
|---|---|---|---|
| Open | Stevens Donna | $75,000 | |
| Previous Owner | Alpers Carl | $81,000 |
Source: Public Records
Tax History Compared to Growth
Tax History
| Year | Tax Paid | Tax Assessment Tax Assessment Total Assessment is a certain percentage of the fair market value that is determined by local assessors to be the total taxable value of land and additions on the property. | Land | Improvement |
|---|---|---|---|---|
| 2025 | $1,797 | $79,851 | $39,550 | $40,301 |
| 2024 | $1,745 | $79,851 | $39,550 | $40,301 |
| 2023 | $1,424 | $72,055 | $33,250 | $38,805 |
| 2022 | $1,695 | $66,180 | $30,450 | $35,730 |
| 2021 | $1,645 | $62,996 | $28,700 | $34,296 |
| 2020 | $1,594 | $62,892 | $28,700 | $34,192 |
| 2019 | $1,548 | $58,043 | $24,150 | $33,893 |
| 2018 | $1,503 | $53,253 | $20,300 | $32,953 |
| 2017 | $1,699 | $50,954 | $18,200 | $32,754 |
| 2016 | $1,424 | $49,222 | $16,100 | $33,122 |
| 2015 | $1,420 | $46,180 | $13,300 | $32,880 |
| 2014 | $1,379 | $44,353 | $11,550 | $32,803 |
Source: Public Records
Map
Nearby Homes
- 2900 Golfside Dr
- 2836 Linkview Dr
- 8713 Litchfield Ave
- 8844 Sunny Mead Ct
- 8701 Millsboro Dr
- 8901 Litchfield Ave
- 8845 Sunny Mead Ct
- 8808 Litchfield Ave
- 8925 Litchfield Ave
- 8904 Evening Star Dr
- 8920 Litchfield Ave
- 3001 Merimar Dr Unit 15
- 3013 Sungold Dr
- 9000 Litchfield Ave
- 8537 Glenmount Dr
- 2652 Golfside Dr
- 8904 Marble Dr
- 9001 Marble Dr
- 3032 Hidden Treasure Dr
- 2900 Crown Ridge Dr
- 8800 Stoney Point Dr
- 8808 Stoney Point Dr
- 8805 Kingsmill Dr
- 8809 Kingsmill Dr
- 8801 Kingsmill Dr
- 8805 Stoney Point Dr
- 8813 Kingsmill Dr
- 8801 Stoney Point Dr Unit 7
- 8809 Stoney Point Dr
- 8817 Kingsmill Dr
- 8813 Stoney Point Dr
- 2904 Golfside Dr
- 2828 Golfside Dr
- 8816 Stoney Point Dr
- 8808 Kingsmill Dr
- 8804 Kingsmill Dr
- 2824 Golfside Dr
- 8812 Kingsmill Dr
- 8804 Sandspring Dr
- 8808 Sandspring Dr