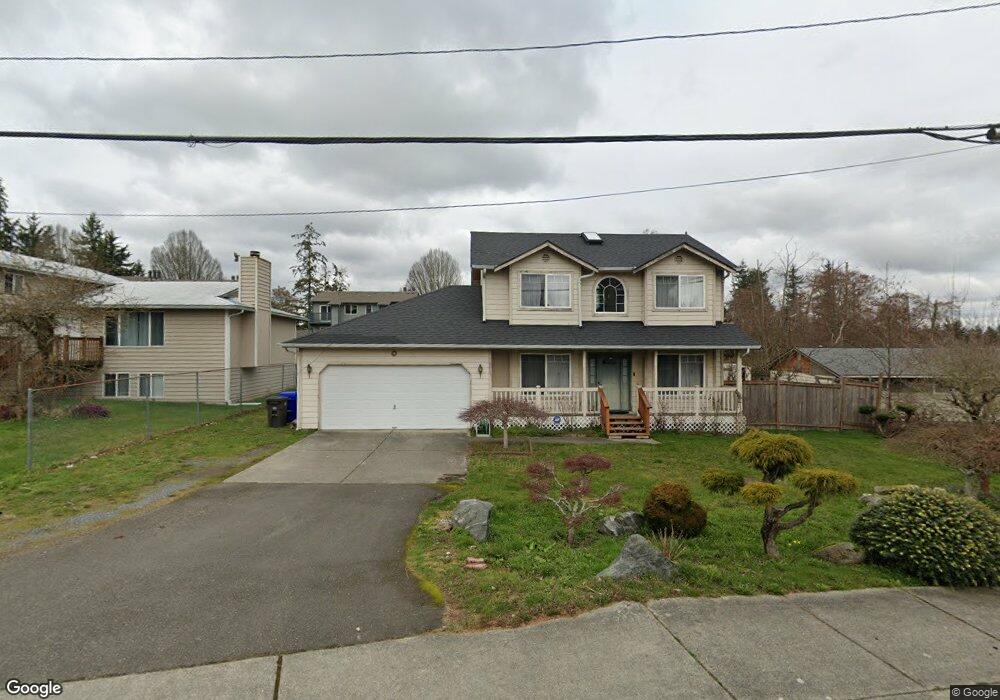
8805 Corbin Dr Everett, WA 98204
Westmont NeighborhoodEstimated Value: $659,000 - $740,000
3
Beds
3
Baths
1,622
Sq Ft
$430/Sq Ft
Est. Value
About This Home
This home is located at 8805 Corbin Dr, Everett, WA 98204 and is currently estimated at $697,477, approximately $430 per square foot. 8805 Corbin Dr is a home located in Snohomish County with nearby schools including Horizon Elementary School, Explorer Middle School, and Mariner High School.
Ownership History
Date
Name
Owned For
Owner Type
Purchase Details
Closed on
Aug 20, 2003
Sold by
Tran Linh
Bought by
Do Hung and Nguyen Dung
Current Estimated Value
Home Financials for this Owner
Home Financials are based on the most recent Mortgage that was taken out on this home.
Original Mortgage
$180,000
Outstanding Balance
$79,149
Interest Rate
5.6%
Mortgage Type
Purchase Money Mortgage
Estimated Equity
$618,328
Purchase Details
Closed on
Jun 6, 2003
Sold by
Taualo Mafulu and Jones Taualo Emily
Bought by
Tran Linh
Purchase Details
Closed on
Dec 20, 1999
Sold by
Cort Joseph and Cort Colleen
Bought by
Taualo Mafulu L and Jones Taualo Emily M
Home Financials for this Owner
Home Financials are based on the most recent Mortgage that was taken out on this home.
Original Mortgage
$172,000
Interest Rate
10.99%
Create a Home Valuation Report for This Property
The Home Valuation Report is an in-depth analysis detailing your home's value as well as a comparison with similar homes in the area
Home Values in the Area
Average Home Value in this Area
Purchase History
| Date | Buyer | Sale Price | Title Company |
|---|---|---|---|
| Do Hung | $225,000 | First American | |
| Tran Linh | $154,466 | -- | |
| Taualo Mafulu L | $215,000 | -- |
Source: Public Records
Mortgage History
| Date | Status | Borrower | Loan Amount |
|---|---|---|---|
| Open | Do Hung | $180,000 | |
| Previous Owner | Taualo Mafulu L | $172,000 | |
| Closed | Taualo Mafulu L | $43,000 |
Source: Public Records
Tax History
| Year | Tax Paid | Tax Assessment Tax Assessment Total Assessment is a certain percentage of the fair market value that is determined by local assessors to be the total taxable value of land and additions on the property. | Land | Improvement |
|---|---|---|---|---|
| 2025 | $4,498 | $578,100 | $337,100 | $241,000 |
| 2024 | $4,498 | $566,600 | $319,100 | $247,500 |
| 2023 | $4,765 | $615,500 | $333,700 | $281,800 |
| 2022 | $4,187 | $468,200 | $229,000 | $239,200 |
| 2020 | $3,378 | $378,800 | $173,900 | $204,900 |
| 2019 | $2,989 | $338,700 | $135,900 | $202,800 |
| 2018 | $3,268 | $319,600 | $138,700 | $180,900 |
| 2017 | $2,883 | $287,500 | $118,800 | $168,700 |
| 2016 | $2,710 | $267,300 | $103,600 | $163,700 |
Source: Public Records
Map
Nearby Homes
- 630 90th St SW Unit A/B
- 226 93rd Place SW Unit 8
- 709 93rd St SW
- 8911 Holly Dr Unit 104
- 8823 Holly Dr Unit D203
- 8823 Holly Dr Unit C102
- 8823 Holly Dr Unit H206
- 8823 Holly Dr Unit H204
- 1001 W Casino Rd Unit C201
- 1001 W Casino Rd Unit A303
- 7910 E Glen Dr
- 1430 W Casino Rd Unit 63
- 1430 W Casino Rd Unit 272
- 112 Barbara Ln
- 9815 Holly Dr Unit A103
- 9917 Holly Dr Unit B307
- 9815 Holly Dr Unit A208
- 9912 Holly Dr Unit A
- 501 75th Place SW
- 1626 93rd Place SW Unit 25
Your Personal Tour Guide
Ask me questions while you tour the home.