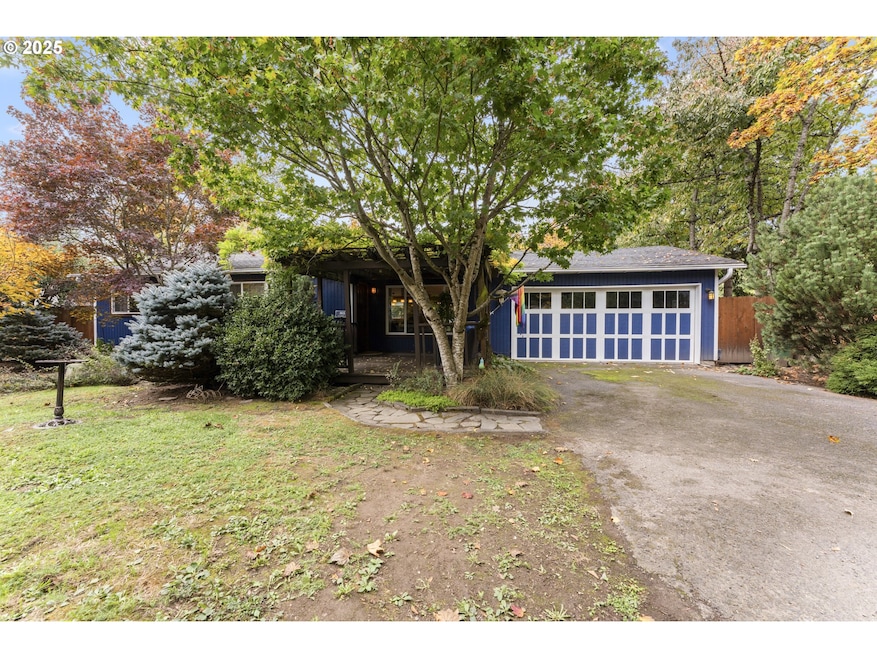
8805 SW Snoopy Ct Portland, OR 97223
Estimated payment $3,119/month
Highlights
- RV Access or Parking
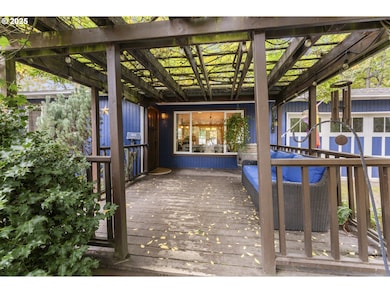
- Deck
- Wood Flooring
- Montclair Elementary School Rated A-
- Territorial View
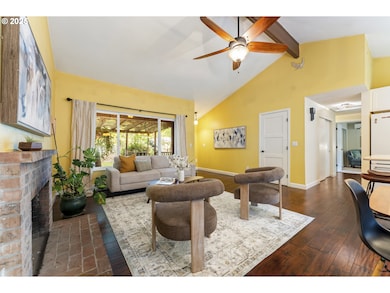
- High Ceiling
About This Home
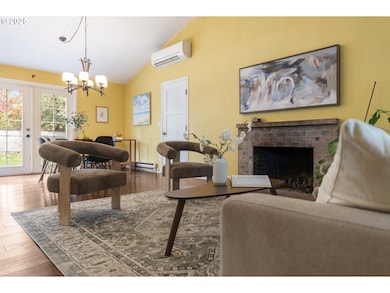
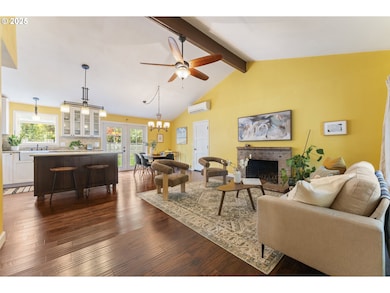
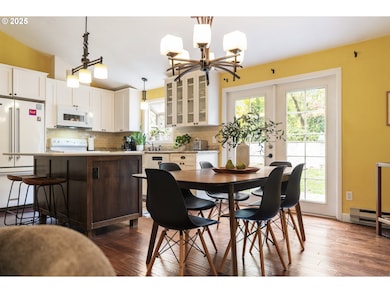
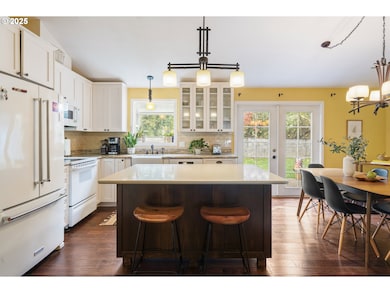
Welcome to 8805 SW Snoopy Ct—a single-level gem tucked into a quiet cul-de-sac with lush landscaping and mature fruit trees. Located in unincorporated Washington County, this home offers lower property taxes while keeping you close to the heart of Portland, with nearby access to Washington Square, HWY 217, and local parks. Inside, you'll find a warm, open-concept layout featuring Budabinga hardwood floors, a beautifully remodeled kitchen (2015), and a cozy wood-burning fireplace. Climate comfort is dialed in with a mini-split in the living room and efficient wall heaters throughout. The updated European-style bathroom features a deep soaking tub within the shower and high-end Toto washlets. The backyard is freshly sodded and ready for relaxing or entertaining. You'll also enjoy the benefit of established apple, plum, and pear trees planted by the sellers. A two-car garage, vinyl windows, and composite roof, round out the home's thoughtful details and durability. This home has been lovingly maintained and offers great flow, natural light, and space to enjoy now—with potential to personalize over time. A true retreat in a peaceful setting.
Home Details
Home Type
- Single Family
Est. Annual Taxes
- $4,224
Year Built
- Built in 1978
Lot Details
- 8,276 Sq Ft Lot
- Cul-De-Sac
- Fenced
- Level Lot
- Private Yard
Parking
- 2 Car Attached Garage
- Garage on Main Level
- Driveway
- RV Access or Parking
Home Design
- Composition Roof
- Plywood Siding Panel T1-11
- Concrete Perimeter Foundation
Interior Spaces
- 1,156 Sq Ft Home
- 1-Story Property
- Wainscoting
- High Ceiling
- Ceiling Fan
- Wood Burning Fireplace
- Vinyl Clad Windows
- Family Room
- Living Room
- Dining Room
- Wood Flooring
- Territorial Views
- Crawl Space
- Washer and Dryer
Kitchen
- Free-Standing Range
- Dishwasher
- Kitchen Island
- Granite Countertops
Bedrooms and Bathrooms
- 3 Bedrooms
- 2 Full Bathrooms
- Soaking Tub
- Walk-in Shower
Accessible Home Design
- Accessibility Features
- Minimal Steps
Outdoor Features
- Deck
Schools
- Montclair Elementary School
- Whitford Middle School
- Southridge High School
Utilities
- Cooling Available
- Heat Pump System
- Electric Water Heater
- High Speed Internet
Community Details
- No Home Owners Association
Listing and Financial Details
- Assessor Parcel Number R227294
Map
Home Values in the Area
Average Home Value in this Area
Tax History
| Year | Tax Paid | Tax Assessment Tax Assessment Total Assessment is a certain percentage of the fair market value that is determined by local assessors to be the total taxable value of land and additions on the property. | Land | Improvement |
|---|---|---|---|---|
| 2025 | $4,047 | $221,870 | -- | -- |
| 2024 | $3,801 | $215,410 | -- | -- |
| 2023 | $3,801 | $209,140 | $0 | $0 |
| 2022 | $3,669 | $209,140 | $0 | $0 |
| 2021 | $3,537 | $197,140 | $0 | $0 |
| 2020 | $3,430 | $191,400 | $0 | $0 |
| 2019 | $3,324 | $185,830 | $0 | $0 |
| 2018 | $3,215 | $180,420 | $0 | $0 |
| 2017 | $3,096 | $175,170 | $0 | $0 |
| 2016 | $2,986 | $170,070 | $0 | $0 |
| 2015 | $2,876 | $165,120 | $0 | $0 |
| 2014 | $2,828 | $160,320 | $0 | $0 |
Property History
| Date | Event | Price | List to Sale | Price per Sq Ft |
|---|---|---|---|---|
| 11/03/2025 11/03/25 | Pending | -- | -- | -- |
| 10/30/2025 10/30/25 | For Sale | $525,000 | -- | $454 / Sq Ft |
Purchase History
| Date | Type | Sale Price | Title Company |
|---|---|---|---|
| Warranty Deed | $173,500 | First American | |
| Special Warranty Deed | $134,181 | Fatco | |
| Warranty Deed | $142,000 | First American Title Co | |
| Interfamily Deed Transfer | -- | -- |
Mortgage History
| Date | Status | Loan Amount | Loan Type |
|---|---|---|---|
| Open | $138,800 | Unknown | |
| Previous Owner | $137,740 | No Value Available | |
| Closed | $34,700 | No Value Available |
Source: Regional Multiple Listing Service (RMLS)
MLS Number: 638946212
APN: R0227294
Disclaimer: Certain information contained herein is derived from information provided by parties other than Homes.com. All information provided is deemed reliable, but is not guaranteed to be accurate and should be independently verified.
![]() The content relating to real estate for sale on this web site comes in part from the IDX program of the RMLS™ of Portland, Oregon. Real estate listings held by brokerage firms other than Ten-X are marked with the RMLS™ logo, and detailed information about these properties includes the names of the listing brokers. Listing content is copyright © 2025 RMLS™, Portland, Oregon. Some properties which appear for sale on this web site may subsequently have sold or may no longer be available. All information provided is deemed reliable but is not guaranteed and should be independently verified.
The content relating to real estate for sale on this web site comes in part from the IDX program of the RMLS™ of Portland, Oregon. Real estate listings held by brokerage firms other than Ten-X are marked with the RMLS™ logo, and detailed information about these properties includes the names of the listing brokers. Listing content is copyright © 2025 RMLS™, Portland, Oregon. Some properties which appear for sale on this web site may subsequently have sold or may no longer be available. All information provided is deemed reliable but is not guaranteed and should be independently verified.
- 8925 SW 80th Ave
- 7849 SW Birch St
- 9024 SW 75th Ave
- 8123 SW Hearthside Ct
- 7480 SW Taylors Ferry Rd
- 8535 SW Oleson Rd
- 8510 SW Cedarcrest St
- 8115 SW Elmwood St
- 7705 SW Alden St
- 7375 SW Ashdale Dr
- 8815 SW Oleson Rd
- 7080 SW Taylors Ferry Rd
- 8770 SW 71st Place
- 8936 SW Zander Ct
- 6985 SW Florence Ln
- 7130 SW Shady Ln
- 6902 SW Taylors Ferry Rd
- 9560 SW 91st Ave Unit 3
- 9556 SW 91st Ave Unit 2
- 9576 SW 91st Ave Unit 7
