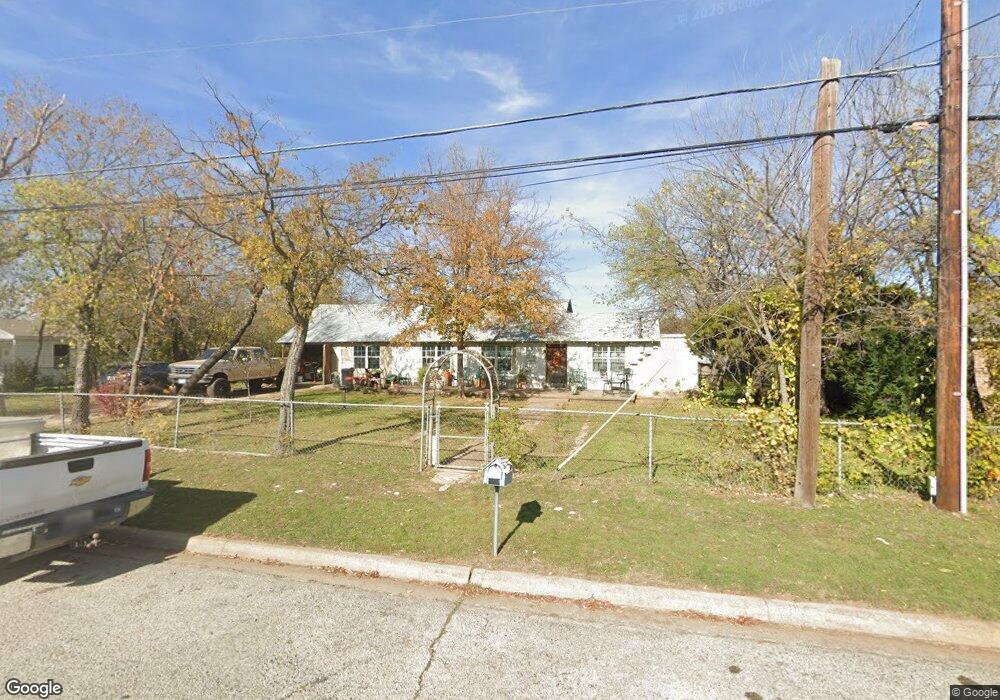
8806 Wilbur St Fort Worth, TX 76108
Estimated Value: $249,787 - $294,000
3
Beds
2
Baths
1,844
Sq Ft
$146/Sq Ft
Est. Value
About This Home
This home is located at 8806 Wilbur St, Fort Worth, TX 76108 and is currently estimated at $269,947, approximately $146 per square foot. 8806 Wilbur St is a home located in Tarrant County with nearby schools including North Elementary School, Brewer Middle School, and Tannahill Intermediate School.
Ownership History
Date
Name
Owned For
Owner Type
Purchase Details
Closed on
Jun 26, 2012
Sold by
Matheus Timothy
Bought by
Villalobos Marisela
Current Estimated Value
Purchase Details
Closed on
May 16, 2012
Sold by
Wyche Aaron Colby
Bought by
Matheus Timothy D
Purchase Details
Closed on
Oct 7, 2011
Sold by
Matheus Timothy
Bought by
Wyche Aaron Colby
Home Financials for this Owner
Home Financials are based on the most recent Mortgage that was taken out on this home.
Original Mortgage
$35,000
Interest Rate
4.28%
Mortgage Type
Seller Take Back
Purchase Details
Closed on
Nov 5, 2008
Sold by
Moorhead Elizabeth Mckinney and Mckinney Daniel Joseph
Bought by
Matheus Timothy D
Purchase Details
Closed on
Jan 15, 2003
Sold by
Kelly Claire
Bought by
Gilbert Wayne
Purchase Details
Closed on
Jul 15, 2002
Sold by
Mckinney Daniel Joseph and Moorhead Elizabeth Mckinney
Bought by
Mckinney Joseph and Moorhead Elizabeth Mckinney
Create a Home Valuation Report for This Property
The Home Valuation Report is an in-depth analysis detailing your home's value as well as a comparison with similar homes in the area
Home Values in the Area
Average Home Value in this Area
Purchase History
| Date | Buyer | Sale Price | Title Company |
|---|---|---|---|
| Villalobos Marisela | -- | None Available | |
| Matheus Timothy D | -- | None Available | |
| Wyche Aaron Colby | -- | None Available | |
| Matheus Timothy D | -- | None Available | |
| Gilbert Wayne | -- | -- | |
| Mckinney Joseph | -- | -- |
Source: Public Records
Mortgage History
| Date | Status | Borrower | Loan Amount |
|---|---|---|---|
| Previous Owner | Wyche Aaron Colby | $35,000 | |
| Closed | Villalobos Marisela | $0 |
Source: Public Records
Tax History Compared to Growth
Tax History
| Year | Tax Paid | Tax Assessment Tax Assessment Total Assessment is a certain percentage of the fair market value that is determined by local assessors to be the total taxable value of land and additions on the property. | Land | Improvement |
|---|---|---|---|---|
| 2025 | $894 | $281,211 | $54,175 | $227,036 |
| 2024 | $894 | $281,211 | $54,175 | $227,036 |
| 2023 | $2,334 | $283,238 | $54,175 | $229,063 |
| 2022 | $2,417 | $211,396 | $25,000 | $186,396 |
| 2021 | $2,231 | $201,628 | $25,000 | $176,628 |
| 2020 | $2,043 | $173,138 | $25,000 | $148,138 |
| 2019 | $1,929 | $165,652 | $25,000 | $140,652 |
| 2018 | $1,280 | $60,948 | $11,000 | $49,948 |
| 2017 | $1,619 | $55,407 | $14,175 | $41,232 |
| 2016 | $1,619 | $55,407 | $14,175 | $41,232 |
| 2015 | $1,591 | $55,407 | $14,175 | $41,232 |
| 2014 | $1,591 | $55,407 | $14,175 | $41,232 |
Source: Public Records
Map
Nearby Homes
- 8814 Clifford St
- 627 Hallvale Dr
- 9005 Glenn Dr
- 8814 Rockway St
- 9201 Clifford St
- 308 Hallvale Dr
- 8811 Silver Creek Rd
- 813 S Kate St
- 304 Lockwood St
- 8401 Clifford St
- 201 N Normandale St
- 204 Lanham Ct
- 1800 N Las Vegas Trail
- 203 East Place
- 8832 Kate St
- 105 Lockwood St
- 633 Lariat Ln
- 813 Hackamore St
- 8321 Raymond Ave
- 311 Russell St
- 8810 Wilbur St
- 8800 Wilbur St
- 607 N Las Vegas Trail
- 609 N Las Vegas Trail
- 611 N Las Vegas Trail
- 8812 Wilbur St
- 521 N Las Vegas Trail
- 8814 Wilbur St
- 8811 Wilbur St
- 613 N Las Vegas Trail
- 608 N Las Vegas Trail
- 610 N Las Vegas Trail
- 8813 Wilbur St
- 8815 Wilbur St
- 8818 Wilbur St
- 612 N Las Vegas Trail
- 615 N Las Vegas Trail
- 520 N Las Vegas Trail
- 513 N Las Vegas Trail
- 8817 Wilbur St