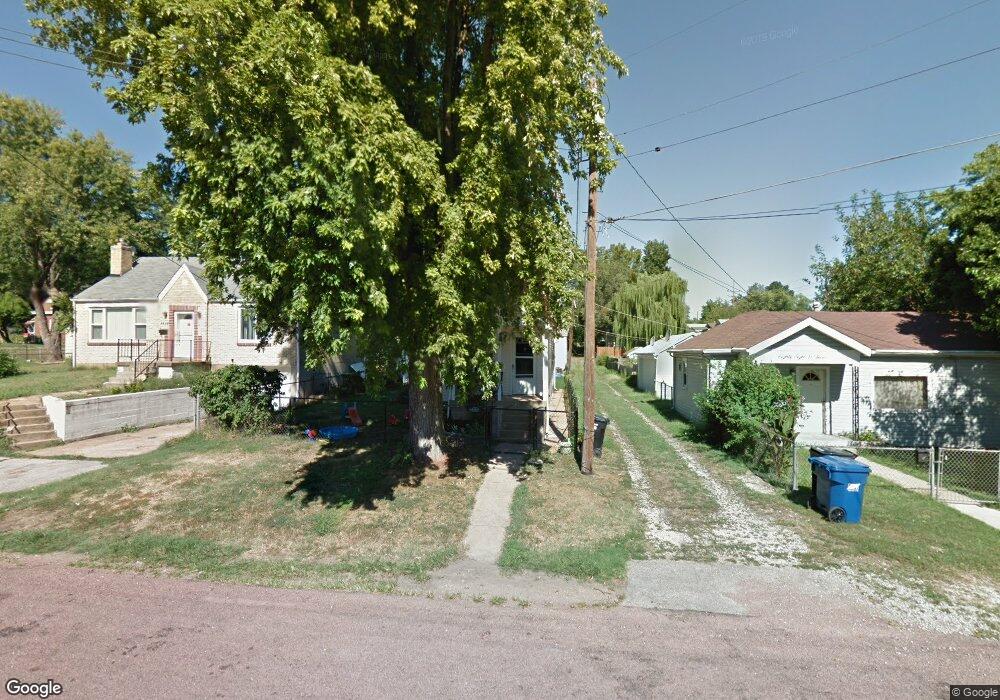
8807 S Grand Ave Saint Louis, MO 63125
Lemay NeighborhoodEstimated Value: $135,000 - $173,000
2
Beds
1
Bath
808
Sq Ft
$184/Sq Ft
Est. Value
About This Home
This home is located at 8807 S Grand Ave, Saint Louis, MO 63125 and is currently estimated at $148,681, approximately $184 per square foot. 8807 S Grand Ave is a home located in St. Louis County with nearby schools including Hancock Place Elementary School, Hancock Place Middle School, and Hancock Place High School.
Ownership History
Date
Name
Owned For
Owner Type
Purchase Details
Closed on
Jul 28, 2005
Sold by
Jmt Real Estate Co Llc
Bought by
Weber Raymind and Oberfield Tabatha
Current Estimated Value
Home Financials for this Owner
Home Financials are based on the most recent Mortgage that was taken out on this home.
Original Mortgage
$86,330
Outstanding Balance
$44,628
Interest Rate
5.51%
Mortgage Type
Fannie Mae Freddie Mac
Estimated Equity
$104,053
Purchase Details
Closed on
Aug 25, 2004
Sold by
Dalton Gerald S
Bought by
Jmt Real Estate Co Llc
Home Financials for this Owner
Home Financials are based on the most recent Mortgage that was taken out on this home.
Original Mortgage
$60,485
Interest Rate
5.97%
Mortgage Type
Purchase Money Mortgage
Purchase Details
Closed on
Nov 23, 1998
Sold by
Dalton Gerald S and Dalton Linda M
Bought by
Dalton Gerald S
Home Financials for this Owner
Home Financials are based on the most recent Mortgage that was taken out on this home.
Original Mortgage
$15,200
Interest Rate
6.69%
Create a Home Valuation Report for This Property
The Home Valuation Report is an in-depth analysis detailing your home's value as well as a comparison with similar homes in the area
Home Values in the Area
Average Home Value in this Area
Purchase History
| Date | Buyer | Sale Price | Title Company |
|---|---|---|---|
| Weber Raymind | $89,000 | It | |
| Jmt Real Estate Co Llc | -- | Integrity Land Title Co Inc | |
| Dalton Gerald S | -- | -- |
Source: Public Records
Mortgage History
| Date | Status | Borrower | Loan Amount |
|---|---|---|---|
| Open | Weber Raymind | $86,330 | |
| Previous Owner | Jmt Real Estate Co Llc | $60,485 | |
| Previous Owner | Dalton Gerald S | $15,200 |
Source: Public Records
Tax History Compared to Growth
Tax History
| Year | Tax Paid | Tax Assessment Tax Assessment Total Assessment is a certain percentage of the fair market value that is determined by local assessors to be the total taxable value of land and additions on the property. | Land | Improvement |
|---|---|---|---|---|
| 2025 | $1,889 | $27,380 | $11,570 | $15,810 |
| 2024 | $1,889 | $24,320 | $4,640 | $19,680 |
| 2023 | $1,794 | $24,320 | $4,640 | $19,680 |
| 2022 | $1,544 | $18,930 | $5,340 | $13,590 |
| 2021 | $1,517 | $18,930 | $5,340 | $13,590 |
| 2020 | $1,400 | $16,660 | $5,340 | $11,320 |
| 2019 | $1,396 | $16,660 | $5,340 | $11,320 |
| 2018 | $1,183 | $12,270 | $4,100 | $8,170 |
| 2017 | $1,163 | $12,270 | $4,100 | $8,170 |
| 2016 | $1,035 | $10,490 | $1,790 | $8,700 |
| 2015 | $1,029 | $10,490 | $1,790 | $8,700 |
| 2014 | $856 | $9,230 | $3,340 | $5,890 |
Source: Public Records
Map
Nearby Homes
- 622 Kayser Ave
- 610 Kayser Ave
- 252 Wachtel Ave
- 241 Dammert Ave
- 8626 Shoss Ave
- 235 Military Rd
- 711 Erskine Ave
- 712 Pardella Ave
- 715 Erskine Ave
- 300 Kayser Ave
- 302 Waller Ave
- 720 Erskine Ave
- 335 Horn Ave
- 8523 Idaho Ave
- 514 E Dallas Ct
- 8439 Tennessee Ave
- 765 Pardella Ave Unit A
- 522 Lagro Ave
- 437 Hoffmeister Ave
- 363 Hoffmeister Ave
- 8809 S Grand Ave
- 8805 S Grand Ave
- 8811 S Grand Ave
- 3606 Fannie Ave
- 3611 Risch Ave
- 8801 S Grand Ave
- 3610 Fannie Ave
- 3617 Risch Ave
- 3612 Fannie Ave
- 86198621 S Grand Ave
- 3614 Fannie Ave
- 3619 Risch Ave
- 712 Fannie Ave
- 3610 Risch Ave
- 3616 Fannie Ave
- 8749 S Grand Ave
- 3614 Risch Ave
- 8915 S Grand Ave
- 721 Fannie Ave
- 3618 Fannie Ave