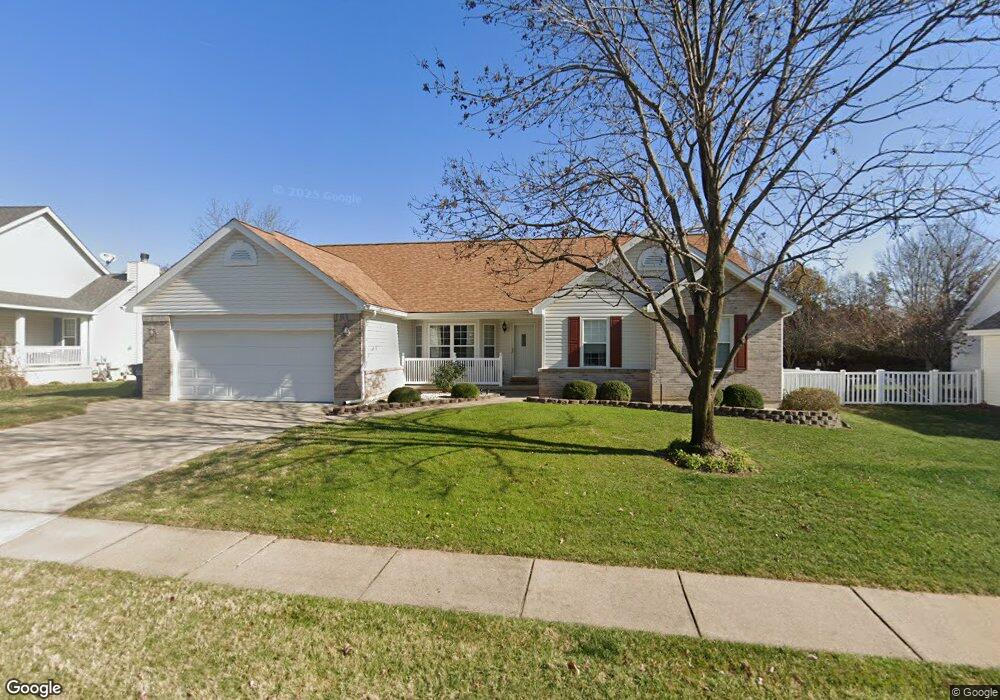
881 Home Park Dr Saint Peters, MO 63376
Estimated Value: $408,550 - $447,000
3
Beds
2
Baths
1,725
Sq Ft
$251/Sq Ft
Est. Value
About This Home
This home is located at 881 Home Park Dr, Saint Peters, MO 63376 and is currently estimated at $432,138, approximately $250 per square foot. 881 Home Park Dr is a home located in St. Charles County with nearby schools including Warren Elementary School, Saeger Middle School, and Francis Howell Central High School.
Ownership History
Date
Name
Owned For
Owner Type
Purchase Details
Closed on
Aug 28, 2020
Sold by
Kelleher Melissa and Melissa Kelleher Trust
Bought by
La Posha Kelleher Residence Trust
Current Estimated Value
Purchase Details
Closed on
Dec 9, 2010
Sold by
Laposha William F
Bought by
Laposha William F and William F Laposha Trust
Purchase Details
Closed on
Jun 24, 2010
Sold by
Kelleher Melissa and Laposha William F
Bought by
Kelleher Melissa and Melissa Kelleher Trust
Purchase Details
Closed on
Mar 20, 2000
Sold by
Mcanally Christopher T M and Mcanally A
Bought by
Laposha William F and Kelleker Melissa
Purchase Details
Closed on
Feb 12, 1997
Sold by
Tom Johnson Construction Co
Bought by
Mcanally Christopher T and Mcanally Anna M
Home Financials for this Owner
Home Financials are based on the most recent Mortgage that was taken out on this home.
Original Mortgage
$112,163
Interest Rate
7.88%
Create a Home Valuation Report for This Property
The Home Valuation Report is an in-depth analysis detailing your home's value as well as a comparison with similar homes in the area
Home Values in the Area
Average Home Value in this Area
Purchase History
| Date | Buyer | Sale Price | Title Company |
|---|---|---|---|
| La Posha Kelleher Residence Trust | -- | None Available | |
| La Posha Kelleher Residence Tr | -- | Beck & Lenox Estate Planning & | |
| Laposha William F | -- | None Available | |
| Kelleher Melissa | -- | None Available | |
| Laposha William F | -- | -- | |
| Mcanally Christopher T | -- | -- |
Source: Public Records
Mortgage History
| Date | Status | Borrower | Loan Amount |
|---|---|---|---|
| Previous Owner | Mcanally Christopher T | $112,163 |
Source: Public Records
Tax History Compared to Growth
Tax History
| Year | Tax Paid | Tax Assessment Tax Assessment Total Assessment is a certain percentage of the fair market value that is determined by local assessors to be the total taxable value of land and additions on the property. | Land | Improvement |
|---|---|---|---|---|
| 2025 | $3,688 | $65,436 | -- | -- |
| 2023 | $3,686 | $61,732 | $0 | $0 |
| 2022 | $3,397 | $52,831 | $0 | $0 |
| 2021 | $3,400 | $52,831 | $0 | $0 |
| 2020 | $3,466 | $52,144 | $0 | $0 |
| 2019 | $3,451 | $52,144 | $0 | $0 |
| 2018 | $3,323 | $47,998 | $0 | $0 |
| 2017 | $3,296 | $47,998 | $0 | $0 |
| 2016 | $3,089 | $43,305 | $0 | $0 |
| 2015 | $3,054 | $43,305 | $0 | $0 |
| 2014 | $2,916 | $40,105 | $0 | $0 |
Source: Public Records
Map
Nearby Homes
- 213 Black Oak Dr
- 120 Glenallen Dr
- 511 Roaring Fork Ct
- 1700 Birdie Hills Rd
- 0 the Rainier@weiss Rd
- New Build Forest H at Weiss Rd
- New Build Forest J at Weiss Rd
- 0 the Indigo@weiss Rd
- 1017 Windsor Crest Ct
- 1313 Commons Cir
- New Build Rainier "F" - Village at Twin Creeks
- TBB Rainier Village at Twin Creeks
- 201 Dardenne Farms Dr
- 113 Scenic Pass Dr
- The Redwood II Plan at Village at Twin Creeks
- The Harbor Plan at Village at Twin Creeks
- The Thornberry Plan at Village at Twin Creeks
- The Savannah Plan at Village at Twin Creeks
- The Glacier Plan at Village at Twin Creeks
- The Rainier Plan at Village at Twin Creeks
- 883 Home Park Dr
- 879 Home Park Dr
- 142 Glenallen Dr
- 882 Home Park Dr
- 885 Home Park Dr
- 877 Home Park Dr
- 884 Home Park Dr
- 140 Glenallen Dr
- 878 Home Park Dr
- 886 Home Park Dr
- 138 Glenallen Dr
- 143 Glenallen Dr
- 875 Home Park Dr
- 887 Home Park Dr
- 876 Home Park Dr
- 309 Black Oak Ct
- 307 Black Oak Ct
- 136 Glenallen Dr
- 888 Home Park Dr
- 873 Home Park Dr