
Landlord's Agent in 2016
Michael Kwan
Denkar Realty Group
(617) 792-7871
106 Total Sales
Estimated Value: $967,861 - $1,147,000
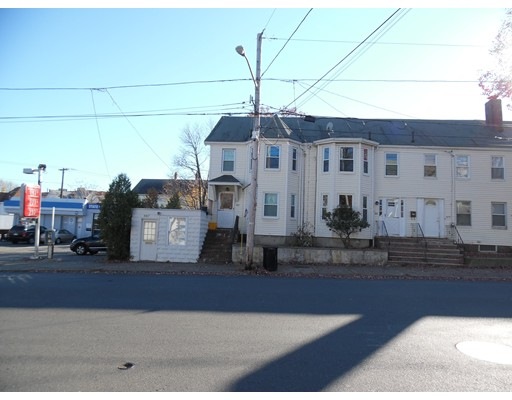
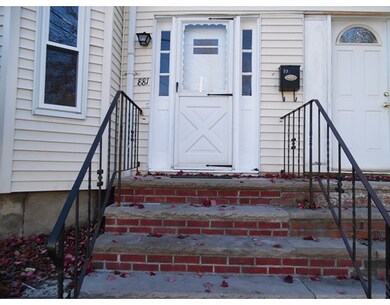
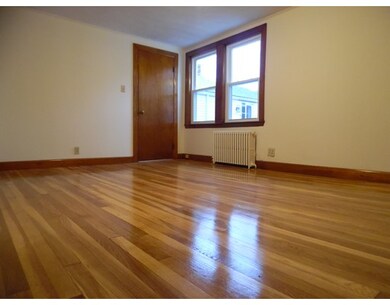
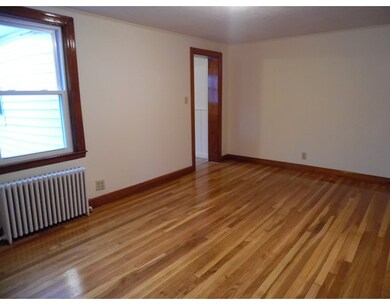
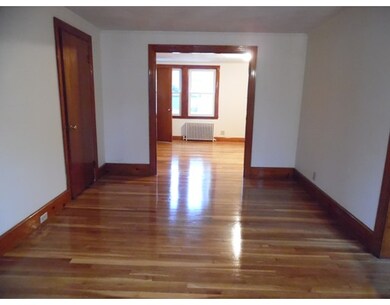
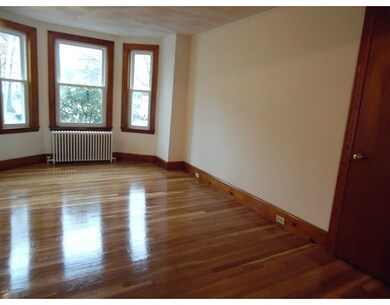
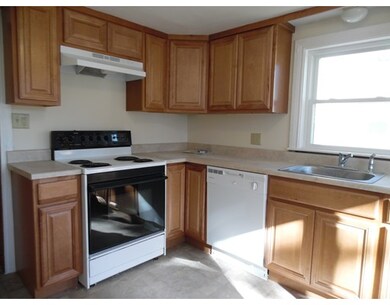
Come to look at this nice house for your rental place, beautiful refinished hardwood floors, 3beds, one and half bath, ready for you to move in for your new home. new cabinets and kitchen countertop. Gas heat. Bus station in front of house take you to Malden Center Station, Revere and Saugus...Showing by appointment with short notice.
Home Type
Other
Year Built
1900
Lot Details
0
| Date | Buyer | Sale Price | Title Company |
|---|---|---|---|
| Michelle Y Kwan Lt | -- | -- | |
| Kwan Raymond J | $520,000 | -- | |
| Malden City Of | $88,357 | -- |
| Date | Status | Borrower | Loan Amount |
|---|---|---|---|
| Previous Owner | Kwan Raymond J | $312,000 |
| Date | Event | Price | List to Sale | Price per Sq Ft |
|---|---|---|---|---|
| 04/08/2016 04/08/16 | Rented | $1,850 | 0.0% | -- |
| 03/23/2016 03/23/16 | For Rent | $1,850 | -- | -- |
| Year | Tax Paid | Tax Assessment Tax Assessment Total Assessment is a certain percentage of the fair market value that is determined by local assessors to be the total taxable value of land and additions on the property. | Land | Improvement |
|---|---|---|---|---|
| 2025 | $89 | $785,300 | $276,500 | $508,800 |
| 2024 | $8,614 | $736,900 | $260,200 | $476,700 |
| 2023 | $8,320 | $682,500 | $235,800 | $446,700 |
| 2022 | $8,007 | $648,300 | $215,500 | $432,800 |
| 2021 | $7,818 | $636,100 | $203,300 | $432,800 |
| 2020 | $7,705 | $609,100 | $204,900 | $404,200 |
| 2019 | $7,454 | $561,700 | $195,200 | $366,500 |
| 2018 | $0 | $494,700 | $164,700 | $330,000 |
| 2017 | -- | $468,700 | $154,500 | $314,200 |
| 2016 | -- | $343,400 | $146,400 | $197,000 |
| 2015 | -- | $307,700 | $129,700 | $178,000 |
| 2014 | -- | $278,300 | $117,900 | $160,400 |
Landlord's Agent in 2016
Michael Kwan
Denkar Realty Group
(617) 792-7871
106 Total Sales
Source: MLS Property Information Network (MLS PIN)
MLS Number: 71976782
APN: MALD-000132-000679-000909
Disclaimer: Certain information contained herein is derived from information provided by parties other than Homes.com. All information provided is deemed reliable, but is not guaranteed to be accurate and should be independently verified.
![]() The property listing data and information, or the Images, set forth herein were provided to MLS Property Information Network, Inc. from third party sources, including sellers, lessors and public records, and were compiled by MLS Property Information Network, Inc. The property listing data and information, and the Images, are for the personal, non-commercial use of consumers having a good faith interest in purchasing or leasing listed properties of the type displayed to them and may not be used for any purpose other than to identify prospective properties which such consumers may have a good faith interest in purchasing or leasing. MLS Property Information Network, Inc. and its subscribers disclaim any and all representations and warranties as to the accuracy of the property listing data and information, or as to the accuracy of any of the Images, set forth herein.
The property listing data and information, or the Images, set forth herein were provided to MLS Property Information Network, Inc. from third party sources, including sellers, lessors and public records, and were compiled by MLS Property Information Network, Inc. The property listing data and information, and the Images, are for the personal, non-commercial use of consumers having a good faith interest in purchasing or leasing listed properties of the type displayed to them and may not be used for any purpose other than to identify prospective properties which such consumers may have a good faith interest in purchasing or leasing. MLS Property Information Network, Inc. and its subscribers disclaim any and all representations and warranties as to the accuracy of the property listing data and information, or as to the accuracy of any of the Images, set forth herein.