Estimated Value: $925,160
8
Beds
5
Baths
3,958
Sq Ft
$234/Sq Ft
Est. Value
About This Home
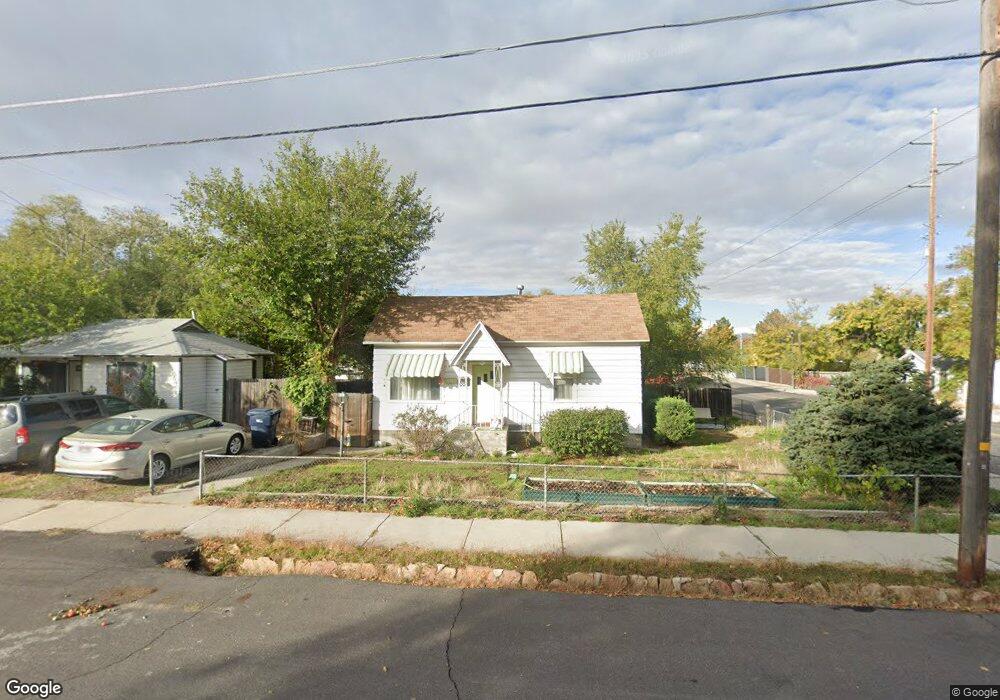
This home is located at 8810 S 220 E, Sandy, UT 84070 and is currently estimated at $925,160, approximately $233 per square foot. 8810 S 220 E is a home located in Salt Lake County with nearby schools including Sandy Elementary School, Mount Jordan Middle School, and Jordan High.
Ownership History
Date
Name
Owned For
Owner Type
Purchase Details
Closed on
Nov 3, 2017
Sold by
Cragun Blakely P
Bought by
Pfd Sandy Llc
Current Estimated Value
Home Financials for this Owner
Home Financials are based on the most recent Mortgage that was taken out on this home.
Original Mortgage
$375,750
Outstanding Balance
$314,694
Interest Rate
3.83%
Mortgage Type
New Conventional
Estimated Equity
$610,466
Purchase Details
Closed on
Jul 20, 2010
Sold by
Webster Arvid L and Webster Virginia
Bought by
Webster Matthew P and Webster Kerrie
Home Financials for this Owner
Home Financials are based on the most recent Mortgage that was taken out on this home.
Original Mortgage
$154,500
Interest Rate
4.68%
Mortgage Type
New Conventional
Purchase Details
Closed on
Oct 12, 2006
Sold by
Webster Arvid L and Webster Virginia
Bought by
Sandy City
Purchase Details
Closed on
Feb 27, 1995
Sold by
Webster Arvid L
Bought by
Webster Arvid L and Webster Virginia
Create a Home Valuation Report for This Property
The Home Valuation Report is an in-depth analysis detailing your home's value as well as a comparison with similar homes in the area
Home Values in the Area
Average Home Value in this Area
Purchase History
| Date | Buyer | Sale Price | Title Company |
|---|---|---|---|
| Pfd Sandy Llc | -- | Cottonwood Title | |
| Cragun Blakely P | -- | North American Title Llc | |
| Webster Matthew P | -- | Cottonwood Title | |
| Sandy City | -- | Founders Title | |
| Sandy City | -- | Founders Title | |
| Webster Arvid L | -- | -- |
Source: Public Records
Mortgage History
| Date | Status | Borrower | Loan Amount |
|---|---|---|---|
| Open | Cragun Blakely P | $375,750 | |
| Previous Owner | Webster Matthew P | $154,500 |
Source: Public Records
Tax History
| Year | Tax Paid | Tax Assessment Tax Assessment Total Assessment is a certain percentage of the fair market value that is determined by local assessors to be the total taxable value of land and additions on the property. | Land | Improvement |
|---|---|---|---|---|
| 2025 | $5,453 | $784,780 | $659,190 | $125,590 |
| 2024 | $5,453 | $763,580 | $581,290 | $182,290 |
| 2023 | $5,496 | $744,180 | $496,790 | $247,390 |
| 2022 | $3,987 | $657,680 | $486,990 | $170,690 |
| 2021 | $3,983 | $560,500 | $438,600 | $121,900 |
| 2020 | $7,197 | $572,400 | $120,500 | $451,900 |
| 2019 | $3,838 | $540,800 | $120,500 | $420,300 |
Source: Public Records
Map
Nearby Homes
- 8558 S Center St
- 270 E 8680 S
- 112 E 8680 S
- 412 E 8760 S
- 220 E Pioneer Ave
- 194 Pioneer Ave
- 149 E Pioneer Ave
- 87 Pioneer Ave
- 227 E St Germain Way
- 8459 S 300 E
- 8470 Solar Way
- 362 E 9150 S
- 87 W 8710 S
- 8732 S 620 E
- 359 E 8400 S
- 627 E 8680 S
- 140 W 8710 S
- 132 E Chambord Ct
- 144 E Chambord Ct
- 140 E Chambord Ct
Your Personal Tour Guide
Ask me questions while you tour the home.