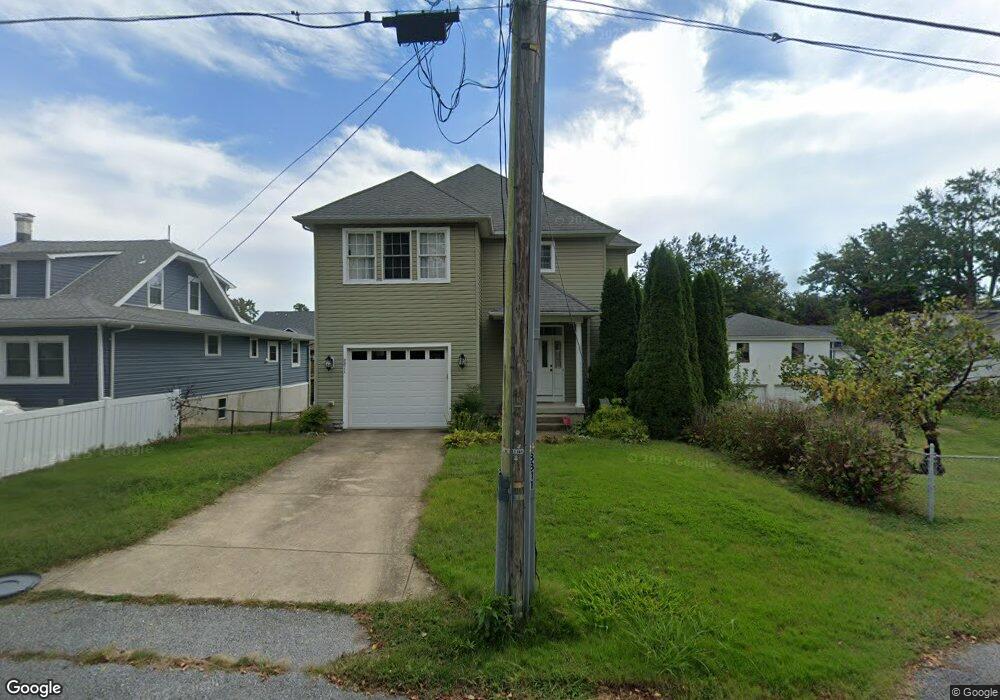
8811 Erie Ave North Beach, MD 20714
Estimated Value: $618,000 - $690,000
3
Beds
3
Baths
2,554
Sq Ft
$254/Sq Ft
Est. Value
About This Home
This home is located at 8811 Erie Ave, North Beach, MD 20714 and is currently estimated at $649,681, approximately $254 per square foot. 8811 Erie Ave is a home located in Calvert County with nearby schools including Windy Hill Elementary School, Windy Hill Middle School, and Northern High School.
Ownership History
Date
Name
Owned For
Owner Type
Purchase Details
Closed on
Dec 17, 2009
Sold by
Southern Maryland Development Llc
Bought by
Garbarczuk Stephanie A
Current Estimated Value
Purchase Details
Closed on
Feb 21, 2007
Sold by
Innocente Darin M
Bought by
Southern Maryland Development Llc
Purchase Details
Closed on
Feb 20, 2007
Sold by
Innocente Darin M
Bought by
Southern Maryland Development Llc
Purchase Details
Closed on
Dec 8, 1999
Sold by
Grierson D Marie
Bought by
Innocente Darin M
Create a Home Valuation Report for This Property
The Home Valuation Report is an in-depth analysis detailing your home's value as well as a comparison with similar homes in the area
Home Values in the Area
Average Home Value in this Area
Purchase History
| Date | Buyer | Sale Price | Title Company |
|---|---|---|---|
| Garbarczuk Stephanie A | $365,900 | -- | |
| Southern Maryland Development Llc | $135,000 | -- | |
| Southern Maryland Development Llc | $135,000 | -- | |
| Innocente Darin M | $90,000 | -- |
Source: Public Records
Mortgage History
| Date | Status | Borrower | Loan Amount |
|---|---|---|---|
| Closed | Garbarczuk Stephanie A | -- |
Source: Public Records
Tax History Compared to Growth
Tax History
| Year | Tax Paid | Tax Assessment Tax Assessment Total Assessment is a certain percentage of the fair market value that is determined by local assessors to be the total taxable value of land and additions on the property. | Land | Improvement |
|---|---|---|---|---|
| 2025 | $7,033 | $533,800 | $92,200 | $441,600 |
| 2024 | $7,033 | $497,367 | $0 | $0 |
| 2023 | $6,517 | $460,933 | $0 | $0 |
| 2022 | $6,270 | $424,500 | $92,200 | $332,300 |
| 2021 | $6,160 | $413,600 | $0 | $0 |
| 2020 | $6,160 | $402,700 | $0 | $0 |
| 2019 | $6,094 | $391,800 | $92,200 | $299,600 |
| 2018 | $5,824 | $372,667 | $0 | $0 |
| 2017 | $5,584 | $353,533 | $0 | $0 |
| 2016 | -- | $334,400 | $0 | $0 |
| 2015 | $5,164 | $334,400 | $0 | $0 |
| 2014 | $5,164 | $334,400 | $0 | $0 |
Source: Public Records
Map
Nearby Homes