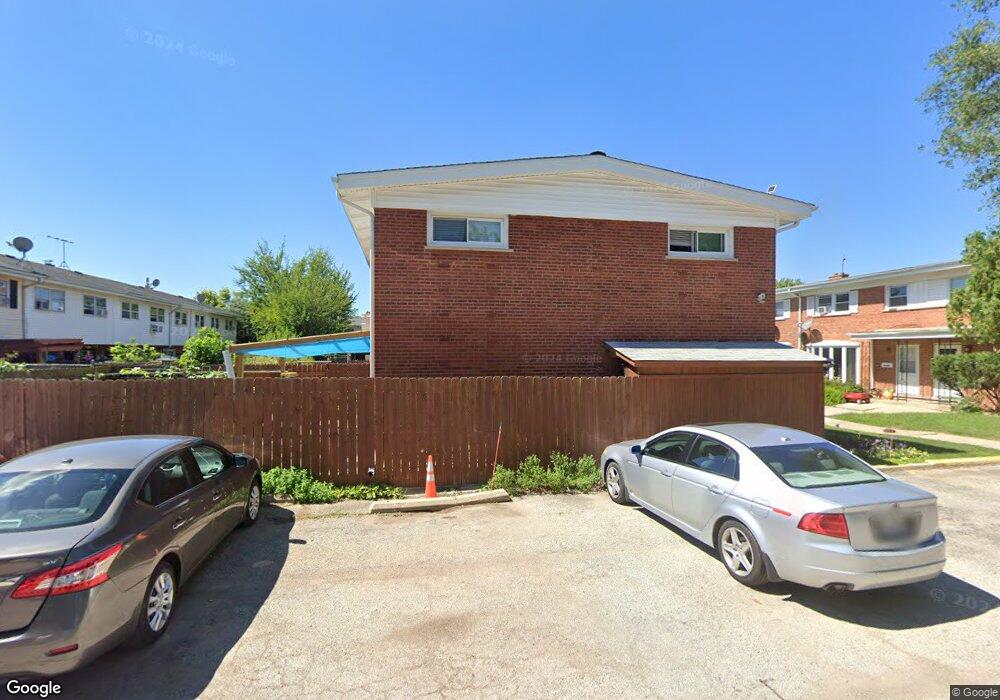
8811 Robin Dr Des Plaines, IL 60016
Estimated Value: $245,000 - $298,000
3
Beds
2
Baths
1,221
Sq Ft
$224/Sq Ft
Est. Value
About This Home
This home is located at 8811 Robin Dr, Des Plaines, IL 60016 and is currently estimated at $273,332, approximately $223 per square foot. 8811 Robin Dr is a home located in Cook County with nearby schools including Apollo Elementary School, Gemini Middle School, and Maine East High School.
Ownership History
Date
Name
Owned For
Owner Type
Purchase Details
Closed on
Jan 4, 2024
Sold by
Abraham Sanjo
Bought by
Abraham Francis and Francis Regeena
Current Estimated Value
Purchase Details
Closed on
May 24, 2013
Sold by
Fannie Mae
Bought by
Abraham Sanjo
Purchase Details
Closed on
Oct 22, 2012
Sold by
Shamseldin
Bought by
Federal National Mortgage Association
Purchase Details
Closed on
May 13, 2004
Sold by
Shamseldin Mona and Alrahman Mona
Bought by
Shamseldin Mona and Mohammed Mohammed
Home Financials for this Owner
Home Financials are based on the most recent Mortgage that was taken out on this home.
Original Mortgage
$173,000
Interest Rate
6.17%
Mortgage Type
New Conventional
Purchase Details
Closed on
Jul 23, 2002
Sold by
Atienza Manuel P and Atienza Agapita B
Bought by
Alrahman Mona
Home Financials for this Owner
Home Financials are based on the most recent Mortgage that was taken out on this home.
Original Mortgage
$169,100
Interest Rate
6.7%
Mortgage Type
Balloon
Create a Home Valuation Report for This Property
The Home Valuation Report is an in-depth analysis detailing your home's value as well as a comparison with similar homes in the area
Home Values in the Area
Average Home Value in this Area
Purchase History
| Date | Buyer | Sale Price | Title Company |
|---|---|---|---|
| Abraham Francis | -- | None Listed On Document | |
| Abraham Sanjo | $68,500 | None Available | |
| Federal National Mortgage Association | -- | None Available | |
| Shamseldin Mona | -- | Multiple | |
| Alrahman Mona | $178,000 | -- |
Source: Public Records
Mortgage History
| Date | Status | Borrower | Loan Amount |
|---|---|---|---|
| Previous Owner | Shamseldin Mona | $173,000 | |
| Previous Owner | Alrahman Mona | $169,100 |
Source: Public Records
Tax History
| Year | Tax Paid | Tax Assessment Tax Assessment Total Assessment is a certain percentage of the fair market value that is determined by local assessors to be the total taxable value of land and additions on the property. | Land | Improvement |
|---|---|---|---|---|
| 2025 | $5,827 | $21,000 | $2,876 | $18,124 |
| 2024 | $5,827 | $21,001 | $3,500 | $17,501 |
| 2023 | $5,541 | $21,500 | $3,500 | $18,000 |
| 2022 | $5,541 | $21,500 | $3,500 | $18,000 |
| 2021 | $3,943 | $12,555 | $1,598 | $10,957 |
| 2020 | $3,851 | $12,555 | $1,598 | $10,957 |
| 2019 | $3,764 | $13,951 | $1,598 | $12,353 |
| 2018 | $4,162 | $13,535 | $1,398 | $12,137 |
| 2017 | $4,497 | $14,829 | $1,398 | $13,431 |
| 2016 | $4,485 | $15,846 | $1,398 | $14,448 |
| 2015 | $4,353 | $14,083 | $1,198 | $12,885 |
| 2014 | $4,201 | $14,083 | $1,198 | $12,885 |
| 2013 | $3,361 | $14,083 | $1,198 | $12,885 |
Source: Public Records
Map
Nearby Homes
- 8843 Robin Dr Unit C
- 8807 Dee Rd
- 8995 Kennedy Dr Unit 206F
- 8810 Briar Ct Unit 1B
- 8802 Briar Ct Unit 3A
- 9241 W Ballard Rd Unit 107
- 1913 Rancho Ln
- 1710 Dempster St Unit A
- 9332 Landings Ln Unit 604
- 9332 Landings Ln Unit 404
- 9332 Landings Ln Unit 504
- 2000 Parkside Dr Unit FG
- 9396 Landings Ln Unit 306
- 9396 Landings Ln Unit 302
- 9396 Landings Ln Unit 202
- 9396 Landings Ln Unit 501
- 9396 Landings Ln Unit 201
- 9396 Landings Ln Unit 401
- 9396 Landings Ln Unit 207
- 8901 N Western Ave Unit A206
- 8811 Robin Dr
- 8811 Robin Dr
- 8811 Robin Dr
- 8811 Robin Dr
- 8811 Robin Dr
- 8811 Robin Dr Unit B
- 8811 Robin Dr Unit C
- 8815 Robin Dr Unit F
- 8815 Robin Dr
- 8815 Robin Dr
- 8815 Robin Dr
- 8815 Robin Dr
- 8815 Robin Dr
- 8815 Robin Dr
- 8815 Robin Dr Unit A
- 8815 Robin Dr Unit D
- 8815 Robin Dr Unit E
- 8815 Robin Dr Unit B
- 8801 Robin Dr Unit E
- 8801 Robin Dr
Your Personal Tour Guide
Ask me questions while you tour the home.