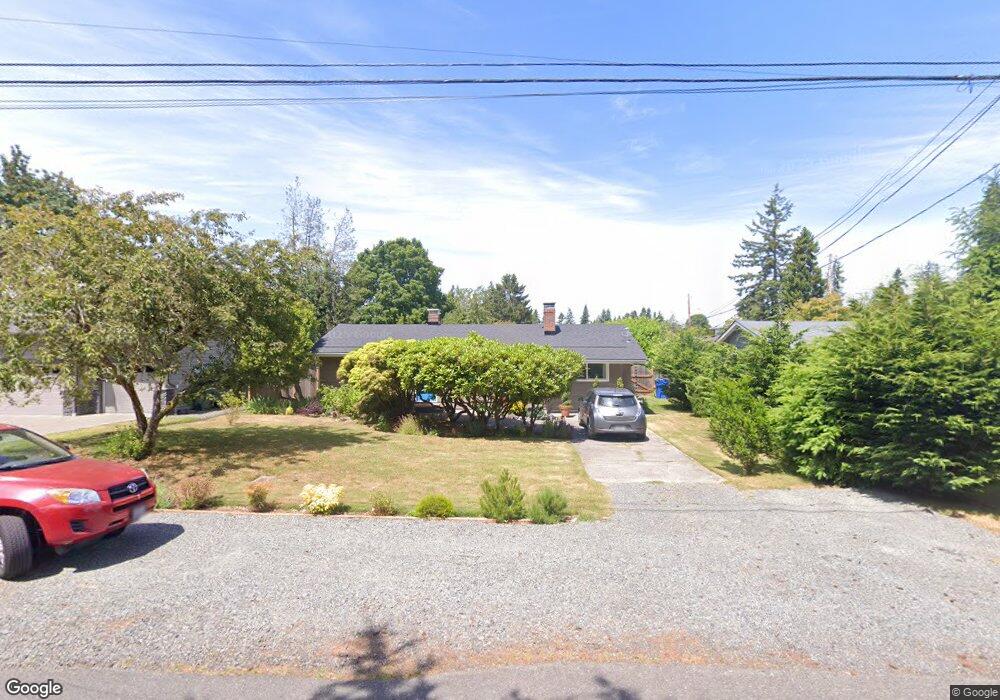
8813 218th St SW Edmonds, WA 98026
Chase Lake NeighborhoodEstimated Value: $759,000 - $958,000
3
Beds
2
Baths
1,364
Sq Ft
$609/Sq Ft
Est. Value
About This Home
This home is located at 8813 218th St SW, Edmonds, WA 98026 and is currently estimated at $830,117, approximately $608 per square foot. 8813 218th St SW is a home located in Snohomish County with nearby schools including Chase Lake Elementary School, College Place Middle School, and Edmonds-Woodway High School.
Ownership History
Date
Name
Owned For
Owner Type
Purchase Details
Closed on
May 16, 2005
Sold by
Hobson James P and Chamberlain Cassandra L
Bought by
Dunkley David A and Chance Beth A
Current Estimated Value
Home Financials for this Owner
Home Financials are based on the most recent Mortgage that was taken out on this home.
Original Mortgage
$258,600
Outstanding Balance
$135,095
Interest Rate
5.87%
Mortgage Type
Fannie Mae Freddie Mac
Estimated Equity
$695,022
Purchase Details
Closed on
Apr 21, 2000
Sold by
Chamberlain Cassandra L and Baker Cassandra L
Bought by
Hobson James P and Chamberlain Cassandra L
Home Financials for this Owner
Home Financials are based on the most recent Mortgage that was taken out on this home.
Original Mortgage
$127,400
Interest Rate
4.35%
Create a Home Valuation Report for This Property
The Home Valuation Report is an in-depth analysis detailing your home's value as well as a comparison with similar homes in the area
Home Values in the Area
Average Home Value in this Area
Purchase History
| Date | Buyer | Sale Price | Title Company |
|---|---|---|---|
| Dunkley David A | $276,000 | First American Title Ins Co | |
| Hobson James P | -- | Chicago Title Insurance Co |
Source: Public Records
Mortgage History
| Date | Status | Borrower | Loan Amount |
|---|---|---|---|
| Open | Dunkley David A | $258,600 | |
| Previous Owner | Hobson James P | $127,400 |
Source: Public Records
Tax History Compared to Growth
Tax History
| Year | Tax Paid | Tax Assessment Tax Assessment Total Assessment is a certain percentage of the fair market value that is determined by local assessors to be the total taxable value of land and additions on the property. | Land | Improvement |
|---|---|---|---|---|
| 2025 | $4,974 | $716,800 | $571,000 | $145,800 |
| 2024 | $4,974 | $704,500 | $559,000 | $145,500 |
| 2023 | $5,197 | $762,900 | $584,000 | $178,900 |
| 2022 | $4,864 | $587,200 | $452,000 | $135,200 |
| 2020 | $4,547 | $489,300 | $355,000 | $134,300 |
| 2019 | $4,223 | $458,000 | $326,000 | $132,000 |
| 2018 | $4,224 | $395,800 | $278,000 | $117,800 |
| 2017 | $3,559 | $349,300 | $241,000 | $108,300 |
| 2016 | $3,257 | $317,000 | $213,000 | $104,000 |
| 2015 | $3,379 | $309,700 | $204,000 | $105,700 |
| 2013 | $2,600 | $224,900 | $138,000 | $86,900 |
Source: Public Records
Map
Nearby Homes
- 7522 221st St SW
- 21505 84th Ave W
- 21232 92nd Place W
- 21224 82nd Place W
- 8500 Main St Unit F313
- 8500 Main St Unit F-209
- 8500 Main St Unit F205
- 228 xx 84th Ave W
- 8732 209th Place SW
- 8225 212th St SW Unit 304
- 8804 209th Place SW
- 21703 97th Ave W
- 7923 220th St SW
- 8012 222nd St SW
- 7909 218th St SW Unit 4
- 9533 Bowdoin Way
- 7924 212th St SW Unit 211
- 7924 212th St SW Unit 104
- 22039 98th Place W
- 22212 98th Ave W
- 8821 218th St SW
- 8807 218th St SW
- 21718 88th Ave W
- 8901 218th St SW
- 8822 217th St SW
- 8802 217th St SW
- 8824 218th St SW
- 8902 217th St SW
- 8909 218th St SW
- 8826 218th St SW
- 8806 218th St SW
- 8729 218th St SW
- 21719 88th Ave W
- 8730 218th St SW
- 8910 217th St SW
- 21707 88th Ave W
- 8820 218th St SW
- 8822 218th St SW
- 8828 218th St SW
- 8915 218th St SW