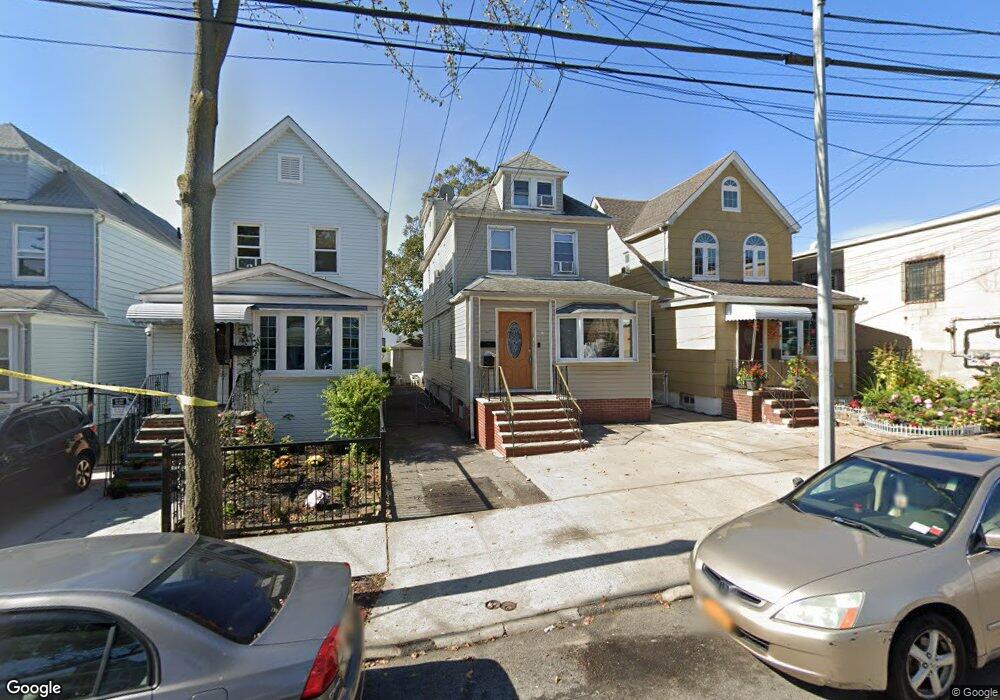
8814 204th St Hollis, NY 11423
Hollis NeighborhoodEstimated Value: $904,000 - $1,033,181
--
Bed
--
Bath
1,552
Sq Ft
$629/Sq Ft
Est. Value
About This Home
This home is located at 8814 204th St, Hollis, NY 11423 and is currently estimated at $975,795, approximately $628 per square foot. 8814 204th St is a home located in Queens County with nearby schools including The Bellaire School, Jean Nuzzi Intermediate School, and The Wellspring Schools.
Ownership History
Date
Name
Owned For
Owner Type
Purchase Details
Closed on
Feb 19, 2025
Sold by
Singh Prahalad
Bought by
Begum Amina and Miah Muhammed Emran
Current Estimated Value
Home Financials for this Owner
Home Financials are based on the most recent Mortgage that was taken out on this home.
Original Mortgage
$799,200
Outstanding Balance
$794,570
Interest Rate
7.04%
Mortgage Type
Purchase Money Mortgage
Estimated Equity
$181,225
Purchase Details
Closed on
Jun 8, 2007
Sold by
Jaffari Syed A and Jaffari Syeda N
Bought by
Singh Prahalad
Home Financials for this Owner
Home Financials are based on the most recent Mortgage that was taken out on this home.
Original Mortgage
$72,300
Interest Rate
6.14%
Purchase Details
Closed on
Aug 8, 2003
Sold by
Scott Carmena and Scott Jack L
Bought by
Jaffari Syed A A and Jaffari Syeda N
Home Financials for this Owner
Home Financials are based on the most recent Mortgage that was taken out on this home.
Original Mortgage
$233,700
Interest Rate
6.29%
Mortgage Type
Purchase Money Mortgage
Create a Home Valuation Report for This Property
The Home Valuation Report is an in-depth analysis detailing your home's value as well as a comparison with similar homes in the area
Home Values in the Area
Average Home Value in this Area
Purchase History
| Date | Buyer | Sale Price | Title Company |
|---|---|---|---|
| Begum Amina | $999,999 | -- | |
| Singh Prahalad | $482,300 | -- | |
| Singh Prahalad | $482,300 | -- | |
| Jaffari Syed A A | $246,000 | -- | |
| Jaffari Syed A A | $246,000 | -- |
Source: Public Records
Mortgage History
| Date | Status | Borrower | Loan Amount |
|---|---|---|---|
| Open | Begum Amina | $799,200 | |
| Previous Owner | Singh Prahalad | $72,300 | |
| Previous Owner | Singh Prahalad | $385,800 | |
| Previous Owner | Jaffari Syed A A | $233,700 |
Source: Public Records
Tax History Compared to Growth
Tax History
| Year | Tax Paid | Tax Assessment Tax Assessment Total Assessment is a certain percentage of the fair market value that is determined by local assessors to be the total taxable value of land and additions on the property. | Land | Improvement |
|---|---|---|---|---|
| 2025 | $6,131 | $32,316 | $8,850 | $23,466 |
| 2024 | $6,131 | $30,524 | $9,356 | $21,168 |
| 2023 | $5,785 | $28,805 | $8,409 | $20,396 |
| 2022 | $5,493 | $42,660 | $13,260 | $29,400 |
| 2021 | $5,791 | $37,800 | $13,260 | $24,540 |
| 2020 | $5,700 | $38,040 | $13,260 | $24,780 |
| 2019 | $5,321 | $37,980 | $13,260 | $24,720 |
| 2018 | $4,893 | $24,004 | $9,716 | $14,288 |
| 2017 | $4,674 | $22,929 | $10,713 | $12,216 |
| 2016 | $4,584 | $22,929 | $10,713 | $12,216 |
| 2015 | $2,609 | $22,442 | $12,246 | $10,196 |
| 2014 | $2,609 | $21,198 | $11,939 | $9,259 |
Source: Public Records
Map
Nearby Homes
- 88-49 202nd St
- 88-12 Francis Lewis Blvd
- 202-35 Foothill Ave Unit B24
- 202-35 Foothill Ave Unit A78
- 204-15 Foothill Ave Unit B53
- 204-15 Foothill Ave Unit B77
- 204-15 Foothill Ave Unit B61
- 204-15 Foothill Ave Unit A34
- 204-15 Foothill Ave Unit A63
- 204-15 Foothill Ave Unit B10
- 204-15 Foothill Ave Unit B42
- 204-15 Foothill Ave Unit B65
- 202 -35 Foothill Ave Unit B42
- 88-38 201st St
- 86-70 Francis Lewis Blvd Unit A-78
- 86-70 Francis Lewis Blvd Unit B-56
- 86-70 Francis Lewis Blvd Unit A-27
- 86-70 Francis Lewis Blvd Unit B65
- 86-70 Francis Lewis Blvd Unit A-53
- 89-42 202nd St