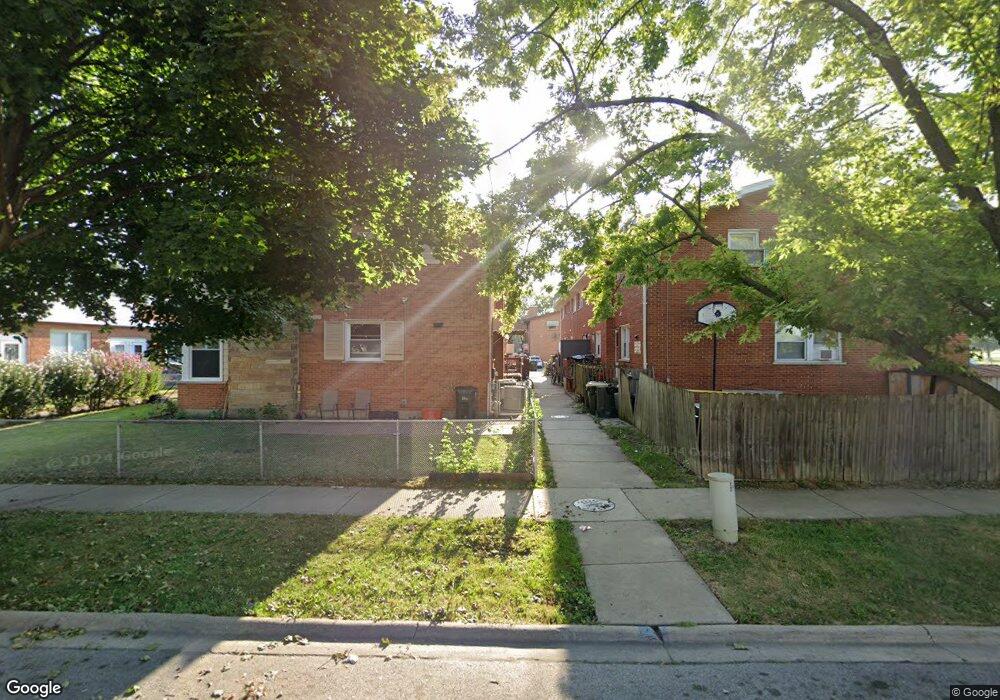
8815 N Grand St Niles, IL 60714
Ballard Terrace NeighborhoodEstimated Value: $312,000 - $333,000
3
Beds
2
Baths
1,208
Sq Ft
$267/Sq Ft
Est. Value
About This Home
This home is located at 8815 N Grand St, Niles, IL 60714 and is currently estimated at $322,651, approximately $267 per square foot. 8815 N Grand St is a home located in Cook County with nearby schools including V H Nelson Elementary School, Gemini Middle School, and Maine East High School.
Ownership History
Date
Name
Owned For
Owner Type
Purchase Details
Closed on
Mar 7, 2007
Sold by
Slonka Malgorzata K
Bought by
Osemobor Victor and Osemobor Juliana
Current Estimated Value
Home Financials for this Owner
Home Financials are based on the most recent Mortgage that was taken out on this home.
Original Mortgage
$276,166
Outstanding Balance
$168,437
Interest Rate
6.4%
Mortgage Type
FHA
Estimated Equity
$154,214
Purchase Details
Closed on
Sep 11, 2006
Sold by
Williams Robbie L
Bought by
Slonka Malgorzata K
Home Financials for this Owner
Home Financials are based on the most recent Mortgage that was taken out on this home.
Original Mortgage
$163,100
Interest Rate
6.37%
Mortgage Type
Unknown
Purchase Details
Closed on
Oct 7, 1997
Sold by
Brubaker Linda A
Bought by
Williams Robbie L
Home Financials for this Owner
Home Financials are based on the most recent Mortgage that was taken out on this home.
Original Mortgage
$128,886
Interest Rate
7.65%
Mortgage Type
FHA
Create a Home Valuation Report for This Property
The Home Valuation Report is an in-depth analysis detailing your home's value as well as a comparison with similar homes in the area
Home Values in the Area
Average Home Value in this Area
Purchase History
| Date | Buyer | Sale Price | Title Company |
|---|---|---|---|
| Osemobor Victor | $280,500 | Ticor Title Insurance | |
| Slonka Malgorzata K | $233,000 | Multiple | |
| Williams Robbie L | $86,666 | -- |
Source: Public Records
Mortgage History
| Date | Status | Borrower | Loan Amount |
|---|---|---|---|
| Open | Osemobor Victor | $276,166 | |
| Previous Owner | Slonka Malgorzata K | $163,100 | |
| Previous Owner | Williams Robbie L | $128,886 |
Source: Public Records
Tax History Compared to Growth
Tax History
| Year | Tax Paid | Tax Assessment Tax Assessment Total Assessment is a certain percentage of the fair market value that is determined by local assessors to be the total taxable value of land and additions on the property. | Land | Improvement |
|---|---|---|---|---|
| 2024 | $5,458 | $24,500 | $4,000 | $20,500 |
| 2023 | $5,101 | $24,500 | $4,000 | $20,500 |
| 2022 | $5,101 | $24,500 | $4,000 | $20,500 |
| 2021 | $3,123 | $14,092 | $1,229 | $12,863 |
| 2020 | $3,016 | $14,092 | $1,229 | $12,863 |
| 2019 | $3,472 | $17,838 | $1,229 | $16,609 |
| 2018 | $3,683 | $17,245 | $1,058 | $16,187 |
| 2017 | $3,663 | $17,245 | $1,058 | $16,187 |
| 2016 | $3,634 | $17,245 | $1,058 | $16,187 |
| 2015 | $3,933 | $17,243 | $887 | $16,356 |
| 2014 | $3,808 | $17,243 | $887 | $16,356 |
| 2013 | $3,479 | $16,098 | $887 | $15,211 |
Source: Public Records
Map
Nearby Homes
- 8803 N Grand St
- 8802 N Prospect St
- 8313 W Ballard Rd
- 8909 N Washington St Unit E
- 8906 N Wisner St
- 8819 N Wisner St
- 9056 N Clifton Ave
- 8426 W Betty Terrace
- 7901 W Park Ave
- 9049 N Greenwood Ave
- 9246 N Courtland Dr
- 7803 Churchill St
- 9138 Greenwood Ave
- 9270 N Courtland Dr
- 7730 Dempster St Unit 304
- 7710 W Dempster St Unit 304
- 8619 W Park Ln
- 7710 Dempster St Unit 204
- 8974 N Western Ave Unit D409
- 8901 N Western Ave Unit A211
- 8819 N Grand St
- 8817 N Grand St
- 8818 N Prospect St
- 8829 N Grand St
- 8805 N Grand St
- 8825 N Grand St
- 8827 N Grand St
- 8809 N Grand St
- 8816 N Prospect St
- 8807 N Grand St
- 8824 N Prospect St
- 8828 N Prospect St
- 8808 N Prospect St
- 8813 N Grand St
- 8806 N Prospect St
- 8814 N Prospect St
- 8811 N Grand St
- 8826 N Prospect St
- 8826 N Prospect St Unit 8826
- 8839 N Grand St