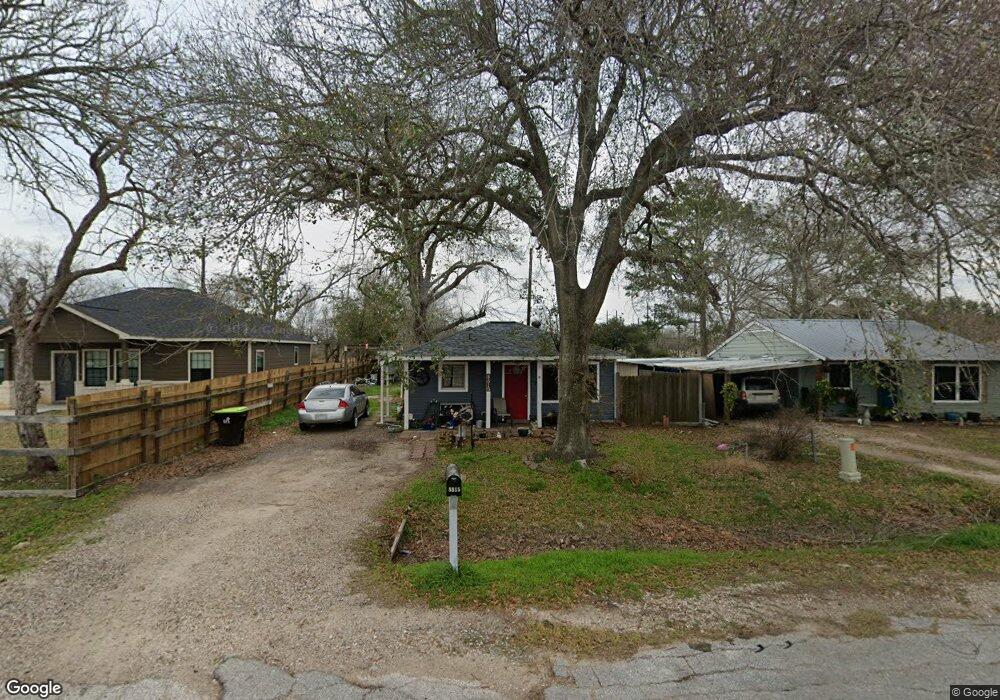
8815 Noble St Needville, TX 77461
Estimated Value: $90,120 - $197,000
1
Bed
1
Bath
797
Sq Ft
$178/Sq Ft
Est. Value
About This Home
This home is located at 8815 Noble St, Needville, TX 77461 and is currently estimated at $142,040, approximately $178 per square foot. 8815 Noble St is a home located in Fort Bend County with nearby schools including Needville Elementary School, Needville Junior High School, and Needville Middle School.
Ownership History
Date
Name
Owned For
Owner Type
Purchase Details
Closed on
Feb 18, 2005
Sold by
Texas Specialty Homes Lp
Bought by
Alderete Andrew and Alderete Joann
Current Estimated Value
Home Financials for this Owner
Home Financials are based on the most recent Mortgage that was taken out on this home.
Original Mortgage
$38,499
Interest Rate
5.92%
Mortgage Type
Seller Take Back
Purchase Details
Closed on
Jun 7, 2004
Sold by
Rembert Michael
Bought by
4W Homes Lp
Purchase Details
Closed on
Aug 26, 1999
Sold by
Major Funding Corp Liquidating Trust
Bought by
Texas Specialty Homes Lp
Purchase Details
Closed on
Dec 29, 1995
Sold by
Gates Carolyn L
Bought by
Sommers Ronald J and The Major Funding Corp Liquidating Trust
Purchase Details
Closed on
Nov 25, 1995
Sold by
Gates Taylor and Gates Rosie
Bought by
Gates Carolyn L
Create a Home Valuation Report for This Property
The Home Valuation Report is an in-depth analysis detailing your home's value as well as a comparison with similar homes in the area
Home Values in the Area
Average Home Value in this Area
Purchase History
| Date | Buyer | Sale Price | Title Company |
|---|---|---|---|
| Alderete Andrew | -- | -- | |
| Alderete Andrew | -- | -- | |
| 4W Homes Lp | -- | -- | |
| Alderete Andrew | -- | -- | |
| Texas Specialty Homes Lp | -- | -- | |
| Sommers Ronald J | -- | -- | |
| Gates Carolyn L | -- | -- |
Source: Public Records
Mortgage History
| Date | Status | Borrower | Loan Amount |
|---|---|---|---|
| Previous Owner | Alderete Andrew | $38,499 |
Source: Public Records
Tax History Compared to Growth
Tax History
| Year | Tax Paid | Tax Assessment Tax Assessment Total Assessment is a certain percentage of the fair market value that is determined by local assessors to be the total taxable value of land and additions on the property. | Land | Improvement |
|---|---|---|---|---|
| 2025 | $337 | $63,063 | $21,730 | $42,177 |
| 2024 | $337 | $57,330 | -- | $58,307 |
| 2023 | $276 | $52,118 | $1,304 | $50,814 |
| 2022 | $256 | $47,380 | $0 | $48,480 |
| 2021 | $971 | $43,070 | $21,730 | $21,340 |
| 2020 | $932 | $39,150 | $21,730 | $17,420 |
| 2019 | $913 | $35,590 | $21,200 | $14,390 |
| 2018 | $822 | $32,350 | $3,710 | $28,640 |
| 2017 | $750 | $29,410 | $3,710 | $25,700 |
| 2016 | $682 | $26,740 | $3,710 | $23,030 |
| 2015 | $218 | $24,310 | $3,710 | $20,600 |
| 2014 | $309 | $22,100 | $3,710 | $18,390 |
Source: Public Records
Map
Nearby Homes
- 13911 W Richmond St
- 0 Tolbert St Unit 36647147
- 8912 Park St
- TBD W 1st St
- 8915 W Richmond St
- 8903 Milby St
- 9206 Kostelnik St
- 8422 W 1st St
- 8813 Altimore Rd
- 3635 Needville Ave
- 8214 Noble St
- 3814 Doveswood Cir
- 3803 Doveswood Cir
- 3418 Schroeder Ave
- 0 Farm To Market Road 1236
- 14120 Farm To Market Road 1236
- 3339 Terry St
- 3811 Candlewood Cir
- 3818 Founders Dr
- 000 Tolbert St
- 8811 Noble St
- 8819 Noble St
- 8807 Noble St
- 8823 Noble St
- 8827 Noble St
- 8805 Noble St
- 8726 W 1st St
- 8803 Noble St
- 8903 Noble St
- 8801 Noble St
- 8906 Noble St
- 13915 W Richmond St
- 8729 Noble St
- 14011 W Richmond St
- 8912 Noble St
- 8725 Noble St
- 14019 W Richmond St
- 13944 Fm 1236 Rd
- 8723 Noble St
- 8902 W 1st St