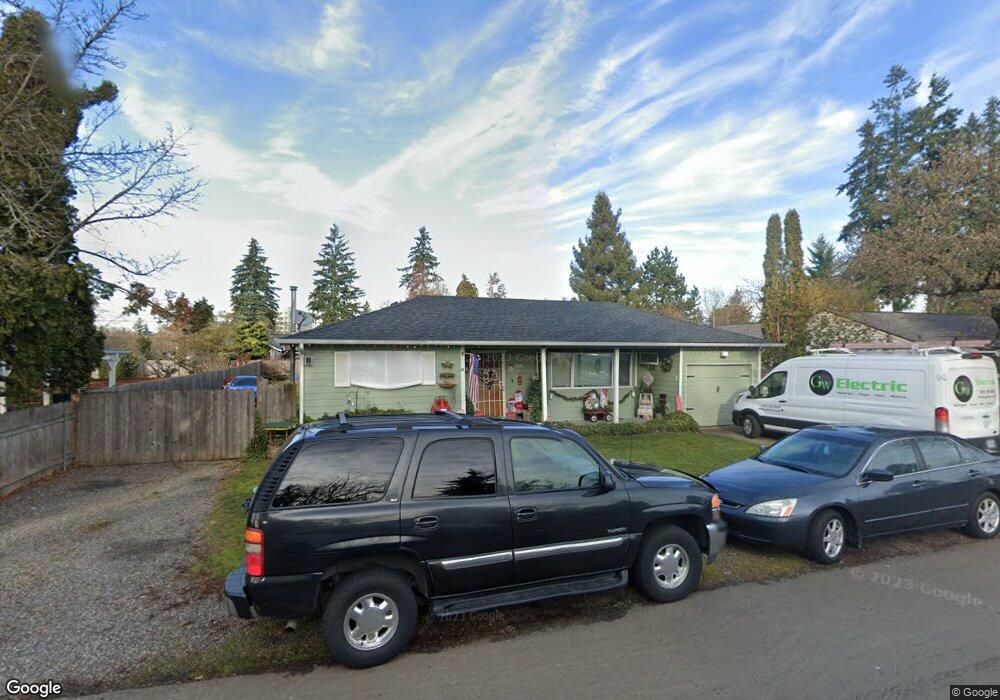
8816 Boulder Ave Vancouver, WA 98664
Vancouver Heights NeighborhoodEstimated Value: $361,000 - $384,000
2
Beds
1
Bath
892
Sq Ft
$421/Sq Ft
Est. Value
About This Home
This home is located at 8816 Boulder Ave, Vancouver, WA 98664 and is currently estimated at $375,785, approximately $421 per square foot. 8816 Boulder Ave is a home located in Clark County with nearby schools including George C. Marshall Elementary School, McLoughlin Middle School, and Fort Vancouver High School.
Ownership History
Date
Name
Owned For
Owner Type
Purchase Details
Closed on
Oct 8, 2008
Sold by
Auvil Charles Brian and Auvil Jolean
Bought by
Auvil Charles Brian and Auvil Jolcan
Current Estimated Value
Home Financials for this Owner
Home Financials are based on the most recent Mortgage that was taken out on this home.
Original Mortgage
$50,000
Outstanding Balance
$32,391
Interest Rate
5.9%
Mortgage Type
New Conventional
Estimated Equity
$343,394
Purchase Details
Closed on
Jun 2, 2008
Sold by
Hunt Joanna
Bought by
Auvil Brian C and Auvil Jolean
Purchase Details
Closed on
Jan 29, 2007
Sold by
Hunt Joanna
Bought by
Hunt Joanna
Purchase Details
Closed on
Jul 29, 2002
Sold by
Auvil Charles Brian and Auvil Jolean
Bought by
Hunt Joanna
Home Financials for this Owner
Home Financials are based on the most recent Mortgage that was taken out on this home.
Original Mortgage
$74,800
Interest Rate
6.7%
Create a Home Valuation Report for This Property
The Home Valuation Report is an in-depth analysis detailing your home's value as well as a comparison with similar homes in the area
Home Values in the Area
Average Home Value in this Area
Purchase History
| Date | Buyer | Sale Price | Title Company |
|---|---|---|---|
| Auvil Charles Brian | -- | First American Equity | |
| Auvil Brian C | $111,719 | None Available | |
| Hunt Joanna | -- | None Available | |
| Hunt Joanna | $93,500 | Chicago Title Insurance Comp |
Source: Public Records
Mortgage History
| Date | Status | Borrower | Loan Amount |
|---|---|---|---|
| Open | Auvil Charles Brian | $50,000 | |
| Previous Owner | Hunt Joanna | $74,800 |
Source: Public Records
Tax History Compared to Growth
Tax History
| Year | Tax Paid | Tax Assessment Tax Assessment Total Assessment is a certain percentage of the fair market value that is determined by local assessors to be the total taxable value of land and additions on the property. | Land | Improvement |
|---|---|---|---|---|
| 2025 | $3,405 | $361,511 | $199,613 | $161,898 |
| 2024 | $3,309 | $348,465 | $199,613 | $148,852 |
| 2023 | $3,227 | $353,489 | $199,613 | $153,876 |
| 2022 | $2,986 | $346,119 | $199,613 | $146,506 |
| 2021 | $2,715 | $298,357 | $172,080 | $126,277 |
| 2020 | $2,460 | $255,684 | $141,734 | $113,950 |
| 2019 | $2,212 | $240,058 | $130,710 | $109,348 |
| 2018 | $2,336 | $223,629 | $0 | $0 |
| 2017 | $2,035 | $196,029 | $0 | $0 |
| 2016 | $1,844 | $178,211 | $0 | $0 |
| 2015 | $1,752 | $154,320 | $0 | $0 |
| 2014 | -- | $138,572 | $0 | $0 |
| 2013 | -- | $117,076 | $0 | $0 |
Source: Public Records
Map
Nearby Homes
- 9020 Boulder Ave
- 8607 Mount Thielson Ave
- 409 SE 95th Ave
- 410 SE 96th Ave
- 220 N Lieser Rd
- 803 SE 94th Ave
- 300 Baltimore Way
- 9012 Mt Lassen Ave
- 1040 SE Columbia Ridge Dr Unit 2
- 8318 SE Middle Way
- 410 SE 100th Ave
- 604 NE 98th Ct
- 8014 SE Middle Way
- 9824 NE Tanglewood Dr
- 515 SE 102nd Ave
- 8405 NE 10th St
- 1504 SE 86th Ct
- 1323 SE Columbia Crest Ct
- 9008 NE 11th St
- 1511 SE 86th Ct
- 8808 Boulder Ave
- 8824 Boulder Ave
- 8901 SE Northgate Ave
- 8905 SE Northgate Ave
- 8900 Boulder Ave
- 8909 SE Northgate Ave
- 8815 SE Northgate Ave
- 8809 Boulder Ave
- 8800 Boulder Ave
- 8817 Boulder Ave
- 301 SE Columbia Ridge Dr
- 8913 SE Northgate Ave
- 8813 SE Northgate Ave
- 8908 Boulder Ave
- 8901 Boulder Ave
- 8904 SE Northgate Ave
- 300 SE Columbia Ridge Dr
- 8808 Silver Star Ave
- 8816 Silver Star Ave
- 8800 Silver Star Ave