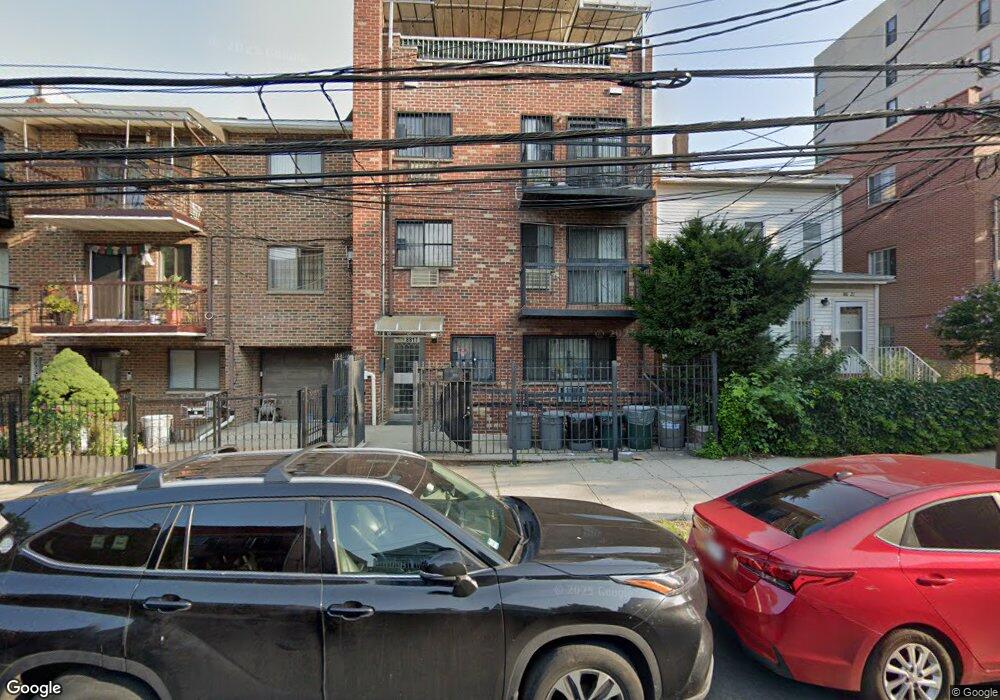
8817 51st Ave Unit 3A Elmhurst, NY 11373
Elmhurst NeighborhoodEstimated Value: $432,137 - $543,000
--
Bed
--
Bath
622
Sq Ft
$777/Sq Ft
Est. Value
About This Home
This home is located at 8817 51st Ave Unit 3A, Elmhurst, NY 11373 and is currently estimated at $483,034, approximately $776 per square foot. 8817 51st Ave Unit 3A is a home located in Queens County with nearby schools including P.S. 7 Louis F Simeone, Is 5 The Walter Crowley Intermediate School, and Newtown High School.
Ownership History
Date
Name
Owned For
Owner Type
Purchase Details
Closed on
Oct 6, 2015
Sold by
Rsl Us Holding Llc
Bought by
Sherpa Namgyal and Yeshi Tenzin
Current Estimated Value
Home Financials for this Owner
Home Financials are based on the most recent Mortgage that was taken out on this home.
Original Mortgage
$178,000
Outstanding Balance
$140,049
Interest Rate
3.88%
Mortgage Type
New Conventional
Estimated Equity
$342,985
Purchase Details
Closed on
May 4, 2011
Sold by
Lau Sue L and Lee Ricky H
Bought by
Rsl Us Holding Llc
Purchase Details
Closed on
Feb 11, 2010
Sold by
Lau Sue Ling
Bought by
Lau Sue Ling and Lee Ricky H
Purchase Details
Closed on
May 31, 2000
Sold by
Chan King Sheen
Bought by
Chan King Sheen and Lau Sue Ling
Create a Home Valuation Report for This Property
The Home Valuation Report is an in-depth analysis detailing your home's value as well as a comparison with similar homes in the area
Home Values in the Area
Average Home Value in this Area
Purchase History
| Date | Buyer | Sale Price | Title Company |
|---|---|---|---|
| Sherpa Namgyal | $338,000 | -- | |
| Sherpa Namgyal | $338,000 | -- | |
| Rsl Us Holding Llc | -- | -- | |
| Rsl Us Holding Llc | -- | -- | |
| Lau Sue Ling | -- | -- | |
| Lau Sue Ling | -- | -- | |
| Chan King Sheen | -- | -- | |
| Chan King Sheen | -- | -- |
Source: Public Records
Mortgage History
| Date | Status | Borrower | Loan Amount |
|---|---|---|---|
| Open | Sherpa Namgyal | $178,000 | |
| Closed | Sherpa Namgyal | $178,000 |
Source: Public Records
Tax History Compared to Growth
Tax History
| Year | Tax Paid | Tax Assessment Tax Assessment Total Assessment is a certain percentage of the fair market value that is determined by local assessors to be the total taxable value of land and additions on the property. | Land | Improvement |
|---|---|---|---|---|
| 2025 | $4,951 | $42,771 | $6,268 | $36,503 |
| 2024 | $4,951 | $39,603 | $6,962 | $32,641 |
| 2023 | $4,584 | $36,669 | $8,154 | $28,515 |
| 2022 | $4,545 | $37,146 | $7,453 | $29,693 |
| 2021 | $5,252 | $42,811 | $7,453 | $35,358 |
| 2020 | $5,860 | $46,985 | $7,453 | $39,532 |
| 2019 | $5,944 | $47,128 | $7,453 | $39,675 |
| 2018 | $7,376 | $57,996 | $7,338 | $50,658 |
| 2017 | $6,830 | $53,703 | $7,226 | $46,477 |
| 2016 | $6,480 | $53,703 | $7,226 | $46,477 |
| 2015 | $1,719 | $50,885 | $7,147 | $43,738 |
| 2014 | $1,719 | $48,181 | $7,399 | $40,782 |
Source: Public Records
Map
Nearby Homes
- 87-22 51st Ave Unit 4E
- 87-22 51st Ave Unit 4H
- 8710 51st Ave Unit 5H
- 8710 51st Ave Unit 1P
- 87-10 51st Ave Unit 3S
- 87-10 51st Ave Unit 6W
- 87-10 51st Ave Unit 3E
- 87-66 52nd Ave
- 88-39 53rd Ave Unit 3A
- 88-27 53rd Ave Unit 2R
- 48-36 90th St
- 8715 Justice Ave
- 8523 Broadway Unit 9B
- 85-23 Broadway Unit 7C
- 86-15 Broadway Unit 4B
- 90-26 52nd Ave
- 88-08 Justice Ave Unit 15N
- 53-11 90th St Unit 3D
- 53-11 90th St
- 53-11 90th St Unit 1F
- 8817 51st Ave Unit 1A
- 8817 51st Ave Unit 3A
- 8817 51st Ave Unit 4
- 8817 51st Ave
- 8817 51st Ave Unit 4A
- 8817 51st Ave Unit 3B
- 8817 51st Ave Unit 2B
- 8817 51st Ave Unit 2A
- 8817 51st Ave Unit 1B
- 8817 51st Ave Unit 1A
- 8817 51st Ave
- 8815 51st Ave
- 8821 51st Ave
- 8823 51st Ave
- 8813 51st Ave
- 8825 51st Ave
- 8811 51st Ave
- 8816 50th Ave
- 8820 50th Ave
- 8809 51st Ave