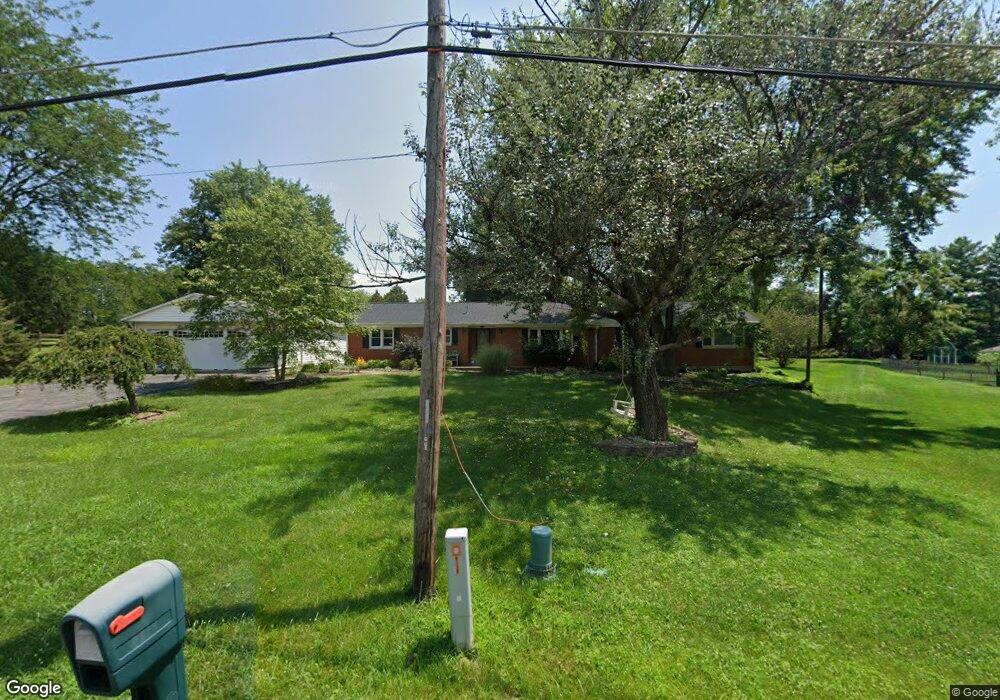
8818 Red Lion 5 Points Rd Springboro, OH 45066
Clearcreek Township NeighborhoodEstimated Value: $313,000 - $432,000
3
Beds
2
Baths
2,212
Sq Ft
$165/Sq Ft
Est. Value
About This Home
This home is located at 8818 Red Lion 5 Points Rd, Springboro, OH 45066 and is currently estimated at $365,419, approximately $165 per square foot. 8818 Red Lion 5 Points Rd is a home located in Warren County with nearby schools including Clearcreek Elementary School, Springboro Intermediate School, and Springboro Junior High School.
Ownership History
Date
Name
Owned For
Owner Type
Purchase Details
Closed on
Oct 22, 2001
Sold by
Meyer Timothy
Bought by
Biddle David H and Biddle Jacqueline L
Current Estimated Value
Home Financials for this Owner
Home Financials are based on the most recent Mortgage that was taken out on this home.
Original Mortgage
$90,000
Outstanding Balance
$35,306
Interest Rate
6.92%
Mortgage Type
New Conventional
Estimated Equity
$330,113
Purchase Details
Closed on
Jan 19, 1999
Sold by
Philpot Michael J
Bought by
Meyer Timothy I Margaret
Purchase Details
Closed on
Sep 29, 1989
Sold by
Breeding James R and Breeding Judy
Bought by
Philpot and Michael James
Purchase Details
Closed on
Aug 19, 1985
Sold by
Music & Paul B
Bought by
Breeding Breeding and Breeding James R
Purchase Details
Closed on
Apr 13, 1984
Sold by
Whiteaker Beecher C and Whiteaker Beecher C
Bought by
Music & Paul B. Et Al
Purchase Details
Closed on
Dec 15, 1978
Sold by
Miracle Miracle and Miracle Clairindia
Create a Home Valuation Report for This Property
The Home Valuation Report is an in-depth analysis detailing your home's value as well as a comparison with similar homes in the area
Home Values in the Area
Average Home Value in this Area
Purchase History
| Date | Buyer | Sale Price | Title Company |
|---|---|---|---|
| Biddle David H | $141,000 | -- | |
| Meyer Timothy I Margaret | $115,000 | -- | |
| Philpot | $86,000 | -- | |
| Breeding Breeding | $68,000 | -- | |
| Music & Paul B. Et Al | $48,000 | -- | |
| -- | $22,500 | -- |
Source: Public Records
Mortgage History
| Date | Status | Borrower | Loan Amount |
|---|---|---|---|
| Open | Biddle David H | $90,000 |
Source: Public Records
Tax History Compared to Growth
Tax History
| Year | Tax Paid | Tax Assessment Tax Assessment Total Assessment is a certain percentage of the fair market value that is determined by local assessors to be the total taxable value of land and additions on the property. | Land | Improvement |
|---|---|---|---|---|
| 2024 | $3,437 | $84,160 | $23,470 | $60,690 |
| 2023 | $2,935 | $66,437 | $12,551 | $53,886 |
| 2022 | $2,935 | $66,437 | $12,551 | $53,886 |
| 2021 | $2,743 | $66,437 | $12,551 | $53,886 |
| 2020 | $2,557 | $54,012 | $10,203 | $43,810 |
| 2019 | $2,370 | $54,012 | $10,203 | $43,810 |
| 2018 | $2,360 | $54,012 | $10,203 | $43,810 |
| 2017 | $2,458 | $50,407 | $9,660 | $40,747 |
| 2016 | $2,557 | $50,407 | $9,660 | $40,747 |
| 2015 | $2,553 | $50,407 | $9,660 | $40,747 |
| 2014 | $2,411 | $45,010 | $8,620 | $36,380 |
| 2013 | $2,410 | $53,230 | $10,200 | $43,030 |
Source: Public Records
Map
Nearby Homes
- 60 Brighton Ct
- 1264 Normandy Rue
- 8301 Red Lion 5 Points Rd
- 9229 Bennington Way
- 640 Springmill Dr
- 9354 Remington Hill Rd
- 9279 Maxwells Crossing
- 9378 Remington Hill Rd
- 320 Springmill Dr
- 9195 Glenridge Blvd
- 639 Birchcreek Way
- 25 Sandelwood St
- 351 Christopher Dr
- 8817 Ridgewood Place
- 8670 Hawthorne Place
- 65 Artesian Ct
- 270 Sycamore Springs Dr
- 412 Belleclaire Hill
- 7940 Bunnell Hill Rd
- 1201 Woodland Greens Blvd
- 8796 Red Lion 5 Points Rd
- 8850 Red Lion 5 Points Rd
- 8850 Red Lion Five Points Rd
- 8939 Red Lion 5 Points Rd
- 8893 Red Lion 5 Points Rd
- 8780 Red Lion 5 Points Rd
- 8878 Red Lion 5 Points Rd
- 8819 Red Lion 5 Points Rd
- 2 Red Lion Five Points Rd
- 2 Red Lion Five Points
- 8857 Bunnell Hill Rd
- 8885 Bunnell Hill Rd
- 8829 Bunnell Hill Rd
- 8888 Red Lion 5 Points Rd
- 8727 Red Lion 5 Points Rd
- 8797 Bunnell Hill Rd
- 8779 Bunnell Hill Rd
- 8714 Red Lion 5 Points Rd
- 179 W Lytle 5 Points Rd
- 179 W Lytle 5 Points Rd