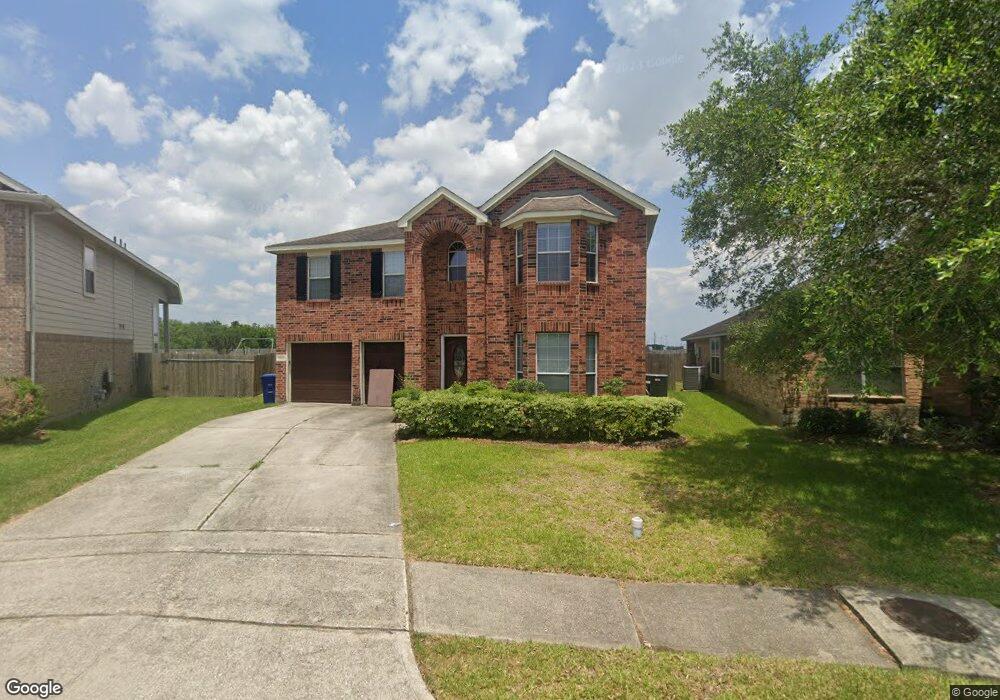
8818 Sombrero St Baytown, TX 77521
Estimated Value: $278,342 - $321,000
4
Beds
3
Baths
2,742
Sq Ft
$108/Sq Ft
Est. Value
About This Home
This home is located at 8818 Sombrero St, Baytown, TX 77521 and is currently estimated at $295,836, approximately $107 per square foot. 8818 Sombrero St is a home located in Harris County with nearby schools including Gentry Junior High School, Goose Creek Memorial High School, and The Chinquapin School.
Ownership History
Date
Name
Owned For
Owner Type
Purchase Details
Closed on
Jun 11, 2018
Sold by
Herrera Fidel
Bought by
Edwards Quinton P
Current Estimated Value
Home Financials for this Owner
Home Financials are based on the most recent Mortgage that was taken out on this home.
Original Mortgage
$120,696
Outstanding Balance
$72,381
Interest Rate
4.5%
Mortgage Type
New Conventional
Estimated Equity
$223,455
Purchase Details
Closed on
Aug 31, 2007
Sold by
Royce Homes Lp
Bought by
Herrera Fidel
Home Financials for this Owner
Home Financials are based on the most recent Mortgage that was taken out on this home.
Original Mortgage
$150,150
Interest Rate
6.72%
Mortgage Type
FHA
Purchase Details
Closed on
May 25, 2007
Sold by
Sowell Equities Highlands Lp
Bought by
Royce Homes Lp
Home Financials for this Owner
Home Financials are based on the most recent Mortgage that was taken out on this home.
Original Mortgage
$120,870
Interest Rate
6.17%
Mortgage Type
Purchase Money Mortgage
Create a Home Valuation Report for This Property
The Home Valuation Report is an in-depth analysis detailing your home's value as well as a comparison with similar homes in the area
Home Values in the Area
Average Home Value in this Area
Purchase History
| Date | Buyer | Sale Price | Title Company |
|---|---|---|---|
| Edwards Quinton P | -- | None Available | |
| Herrera Fidel | -- | None Available | |
| Royce Homes Lp | -- | Stewart Title Houston Div |
Source: Public Records
Mortgage History
| Date | Status | Borrower | Loan Amount |
|---|---|---|---|
| Open | Edwards Quinton P | $120,696 | |
| Previous Owner | Herrera Fidel | $150,150 | |
| Previous Owner | Royce Homes Lp | $120,870 |
Source: Public Records
Tax History Compared to Growth
Tax History
| Year | Tax Paid | Tax Assessment Tax Assessment Total Assessment is a certain percentage of the fair market value that is determined by local assessors to be the total taxable value of land and additions on the property. | Land | Improvement |
|---|---|---|---|---|
| 2025 | $4,452 | $265,622 | $50,208 | $215,414 |
| 2024 | $4,452 | $264,536 | $50,208 | $214,328 |
| 2023 | $4,452 | $282,413 | $50,208 | $232,205 |
| 2022 | $6,059 | $262,744 | $50,208 | $212,536 |
| 2021 | $5,934 | $215,377 | $50,208 | $165,169 |
| 2020 | $5,702 | $203,570 | $50,208 | $153,362 |
| 2019 | $6,148 | $209,305 | $50,208 | $159,097 |
| 2018 | $3,008 | $178,853 | $35,146 | $143,707 |
| 2017 | $5,298 | $178,853 | $35,146 | $143,707 |
| 2016 | $5,216 | $176,064 | $35,146 | $140,918 |
| 2015 | $4,277 | $161,658 | $20,674 | $140,984 |
| 2014 | $4,277 | $137,869 | $20,674 | $117,195 |
Source: Public Records
Map
Nearby Homes
- 5243 El Tigre Ln
- 5443 Espuela Ln
- 9015 Arctic Rockfish Dr
- 00 Garth Rd
- Glenbrook II Plan at Scotts Bend - Fairway Collection
- Oxford Plan at Scotts Bend - Watermill Collection
- Joplin Plan at Scotts Bend - Classic Collection
- Wakefield II Plan at Scotts Bend - Fairway Collection
- Kitson Plan at Pelly Place - Cottage Collection
- Cantaron II Plan at Scotts Bend - Fairway Collection
- Idlewood Plan at Pelly Place - Cottage Collection
- Willow II Plan at Pelly Place - Avante Collection
- Beckman Plan at Scotts Bend - Watermill Collection
- Dashwood Plan at Scotts Bend - Bristol Collection
- Frey Plan at Scotts Bend - Classic Collection
- Somerset Plan at Scotts Bend - Fairway Collection
- Pearce Plan at Scotts Bend - Watermill Collection
- Hendrix Plan at Scotts Bend - Classic Collection
- Austen Plan at Scotts Bend - Bristol Collection
- Everett II Plan at Pelly Place - Avante Collection
- 8814 Sombrero St
- 5327 El Tigre Ln
- 8810 Sombrero St
- 5323 El Tigre Ln
- 8806 Sombrero St
- 5318 El Tigre Ln
- 5319 El Tigre Ln
- 5339 Espuela Ln
- 5314 El Tigre Ln
- 5403 Espuela Ln
- 5315 El Tigre Ln
- 5319 Espuela Ln
- 8802 Sombrero St
- 5310 El Tigre Ln
- 5407 Espuela Ln
- 5315 Espuela Ln
- 5311 El Tigre Ln
- 5411 Espuela Ln
- 5306 El Tigre Ln
- 5307 El Tigre Ln