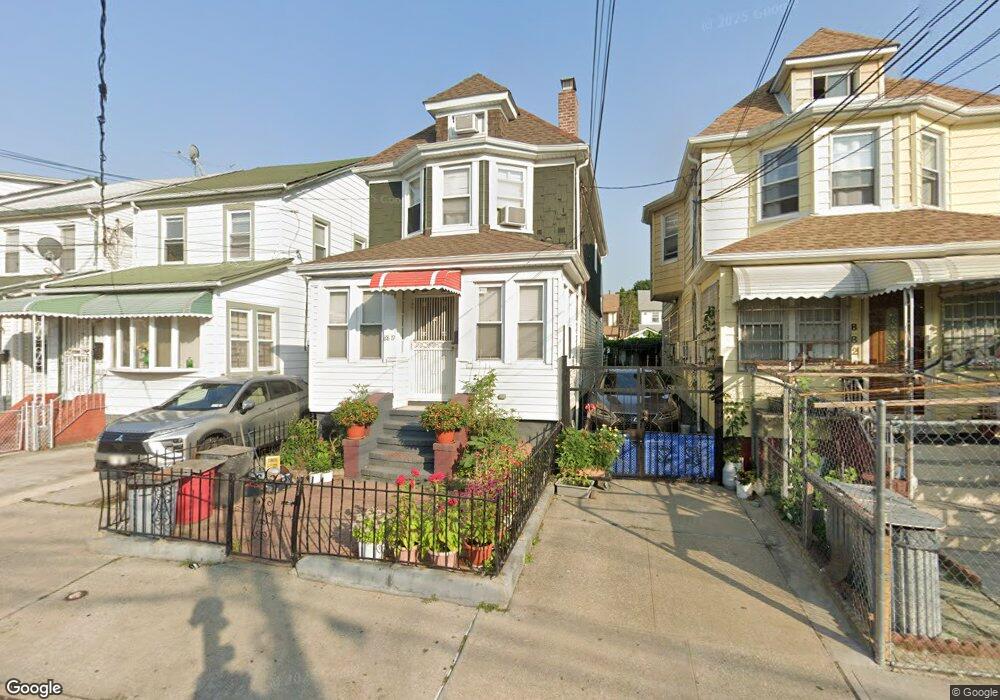
8819 Saint James Ave Elmhurst, NY 11373
Elmhurst NeighborhoodEstimated Value: $976,439 - $1,205,000
3
Beds
3
Baths
1,362
Sq Ft
$791/Sq Ft
Est. Value
About This Home
This home is located at 8819 Saint James Ave, Elmhurst, NY 11373 and is currently estimated at $1,077,360, approximately $791 per square foot. 8819 Saint James Ave is a home located in Queens County with nearby schools including P.S. 13 Clement C Moore, Is 5 The Walter Crowley Intermediate School, and Newtown High School.
Ownership History
Date
Name
Owned For
Owner Type
Purchase Details
Closed on
Jun 4, 2014
Sold by
Jiang Deli
Bought by
Jiang Deli and Jiang Qiu Li
Current Estimated Value
Purchase Details
Closed on
Apr 25, 2002
Sold by
Yang Jessica Xiao Geng
Bought by
Zheng Yi and Lin Denfeng
Home Financials for this Owner
Home Financials are based on the most recent Mortgage that was taken out on this home.
Original Mortgage
$253,000
Interest Rate
7.01%
Purchase Details
Closed on
Aug 23, 2001
Sold by
Zhan Yi Qiang and Yang Xiao Geng
Bought by
Yang Jessica Xiao Geng
Purchase Details
Closed on
Nov 7, 1995
Sold by
Mcbride Bernard J and Mcbride Richard
Bought by
Zhan Yi Qiang and Yang Xiao Geng
Home Financials for this Owner
Home Financials are based on the most recent Mortgage that was taken out on this home.
Original Mortgage
$160,000
Interest Rate
7.44%
Create a Home Valuation Report for This Property
The Home Valuation Report is an in-depth analysis detailing your home's value as well as a comparison with similar homes in the area
Home Values in the Area
Average Home Value in this Area
Purchase History
| Date | Buyer | Sale Price | Title Company |
|---|---|---|---|
| Jiang Deli | -- | -- | |
| Zheng Yi | -- | -- | |
| Yang Jessica Xiao Geng | -- | -- | |
| Zhan Yi Qiang | $171,000 | Commonwealth Land Title Ins |
Source: Public Records
Mortgage History
| Date | Status | Borrower | Loan Amount |
|---|---|---|---|
| Previous Owner | Zheng Yi | $253,000 | |
| Previous Owner | Zhan Yi Qiang | $160,000 |
Source: Public Records
Tax History Compared to Growth
Tax History
| Year | Tax Paid | Tax Assessment Tax Assessment Total Assessment is a certain percentage of the fair market value that is determined by local assessors to be the total taxable value of land and additions on the property. | Land | Improvement |
|---|---|---|---|---|
| 2025 | $6,855 | $37,662 | $10,567 | $27,095 |
| 2024 | $6,867 | $35,532 | $10,192 | $25,340 |
| 2023 | $6,627 | $34,396 | $9,877 | $24,519 |
| 2022 | $6,236 | $56,040 | $15,420 | $40,620 |
| 2021 | $6,580 | $54,180 | $15,420 | $38,760 |
| 2020 | $6,345 | $52,800 | $15,420 | $37,380 |
| 2019 | $5,901 | $53,040 | $15,420 | $37,620 |
| 2018 | $5,545 | $28,663 | $9,680 | $18,983 |
| 2017 | $5,251 | $27,228 | $9,559 | $17,669 |
| 2016 | $5,133 | $27,228 | $9,559 | $17,669 |
| 2015 | $2,878 | $26,154 | $11,114 | $15,040 |
| 2014 | $2,878 | $24,675 | $12,125 | $12,550 |
Source: Public Records
Map
Nearby Homes
- 47-11 90th St
- 4606 88th St Unit 5B
- 90-19 Corona Ave
- 48-36 90th St
- 44-29 Ketcham St
- 91-08 43rd Ave
- 44-21 MacNish St Unit 6C
- 44-21 MacNish St Unit 2G
- 44-25 MacNish St Unit 4F
- 44-25 MacNish St Unit 6D
- 44-25 MacNish St Unit 4A
- 44-11 MacNish St Unit 5C
- 44-11 MacNish St Unit 1E
- 4425 MacNish St Unit 5B
- 44-11 MacNish St Unit 2D
- 42-87 Hampton St
- 44-16 MacNish St Unit 1C
- 91-16 43rd Ave
- 44-10 Ketcham St Unit 3F
- 8710 51st Ave Unit 1P
- 8819 Saint James Ave
- 8817 Saint James Ave
- 8821 Saint James Ave
- 88-15 Saint James Ave
- 8815 Saint James Ave
- 8823 Saint James Ave
- 8813 Saint James Ave
- 8813 Saint James Ave
- 8825 Saint James Ave
- 8811 Saint James Ave
- 8829 Saint James Ave
- 8824 45th Ave
- 8822 45th Ave
- 8826 45th Ave
- 8830 45th Ave
- 8816 Saint James Ave
- 8818 Saint James Ave
- 8820 Saint James Ave
- 8833 Saint James Ave
- 8822 Saint James Ave