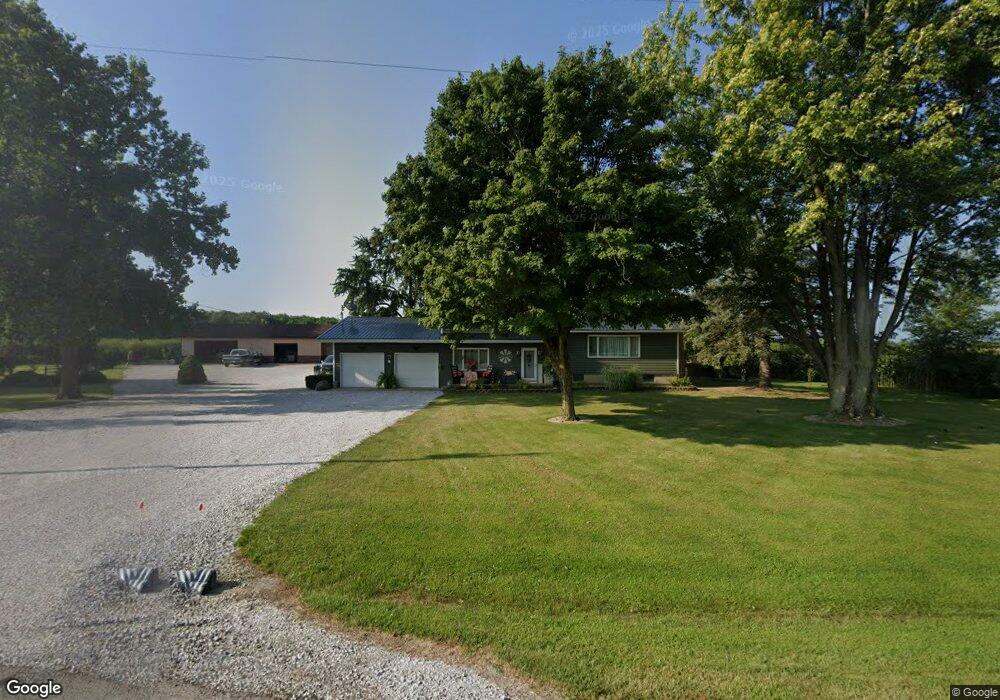
8819 W Delphi Pike Unit PK27 Converse, IN 46919
Estimated Value: $270,000 - $306,276
3
Beds
2
Baths
3,049
Sq Ft
$94/Sq Ft
Est. Value
About This Home
This home is located at 8819 W Delphi Pike Unit PK27, Converse, IN 46919 and is currently estimated at $287,569, approximately $94 per square foot. 8819 W Delphi Pike Unit PK27 is a home located in Grant County with nearby schools including Converse Elementary School, Sweetser Elementary School, and Oak Hill Junior High School.
Ownership History
Date
Name
Owned For
Owner Type
Purchase Details
Closed on
Sep 28, 2007
Sold by
Larimore Danny L and Larimore James L
Bought by
Larimore Monte R and Larimore Debi A
Current Estimated Value
Home Financials for this Owner
Home Financials are based on the most recent Mortgage that was taken out on this home.
Original Mortgage
$132,000
Outstanding Balance
$23,031
Interest Rate
6.55%
Mortgage Type
New Conventional
Estimated Equity
$264,538
Create a Home Valuation Report for This Property
The Home Valuation Report is an in-depth analysis detailing your home's value as well as a comparison with similar homes in the area
Home Values in the Area
Average Home Value in this Area
Purchase History
| Date | Buyer | Sale Price | Title Company |
|---|---|---|---|
| Larimore Monte R | -- | None Available |
Source: Public Records
Mortgage History
| Date | Status | Borrower | Loan Amount |
|---|---|---|---|
| Open | Larimore Monte R | $132,000 |
Source: Public Records
Tax History Compared to Growth
Tax History
| Year | Tax Paid | Tax Assessment Tax Assessment Total Assessment is a certain percentage of the fair market value that is determined by local assessors to be the total taxable value of land and additions on the property. | Land | Improvement |
|---|---|---|---|---|
| 2024 | $2,039 | $273,700 | $19,700 | $254,000 |
| 2023 | $1,928 | $251,900 | $20,300 | $231,600 |
| 2022 | $2,223 | $231,000 | $19,000 | $212,000 |
| 2021 | $1,761 | $214,900 | $19,000 | $195,900 |
| 2020 | $1,697 | $216,800 | $19,000 | $197,800 |
| 2019 | $1,709 | $225,300 | $19,000 | $206,300 |
| 2018 | $1,444 | $206,400 | $17,300 | $189,100 |
| 2017 | $1,233 | $196,700 | $17,300 | $179,400 |
| 2016 | $1,115 | $187,600 | $17,300 | $170,300 |
| 2014 | $958 | $171,000 | $17,300 | $153,700 |
| 2013 | $958 | $170,000 | $17,300 | $152,700 |
Source: Public Records
Map
Nearby Homes
- 7405 W Mier 27
- 36 Howard St
- 9420 W North 00 S 27
- 105 W Wabash St
- 106 W Water St
- 5292 W Delphi Pike
- 603 Broadway St
- 110 Greenberry St
- 105 Peterson Dr
- 218 Greenberry St
- 119 Short St
- 0 Pennsylvania Ave
- 1252 S 600 W
- 203 Eagle Dr
- 514 Allen Dr
- 638 Laura Ln
- 516 Nancy Dr
- 207 W Marks St
- 207 W Lincoln St
- 606 S Sims St
- 8753 W Delphi Pike
- 8866 W Delphi Pike
- 8924 W Delphi Pike
- 8831 W Mier 27
- 8962 W Delphi Pike
- 8832 W Mier 27
- 8896 W Mier 27
- 8665 W Mier 27
- 1700 N 900 W 27
- 8990 W Delphi Pike
- 1571 N 900 W 27
- 8584 W Delphi Pike
- 1697 N 900 W 27
- 1333 N 900 West - 27
- 8558 W Delphi Pike
- 8533 W Delphi Pike
- 8513 W Delphi Pike
- 8514 W Delphi Pike
- 8493 W Delphi Pike
- 8473 W Delphi Pike