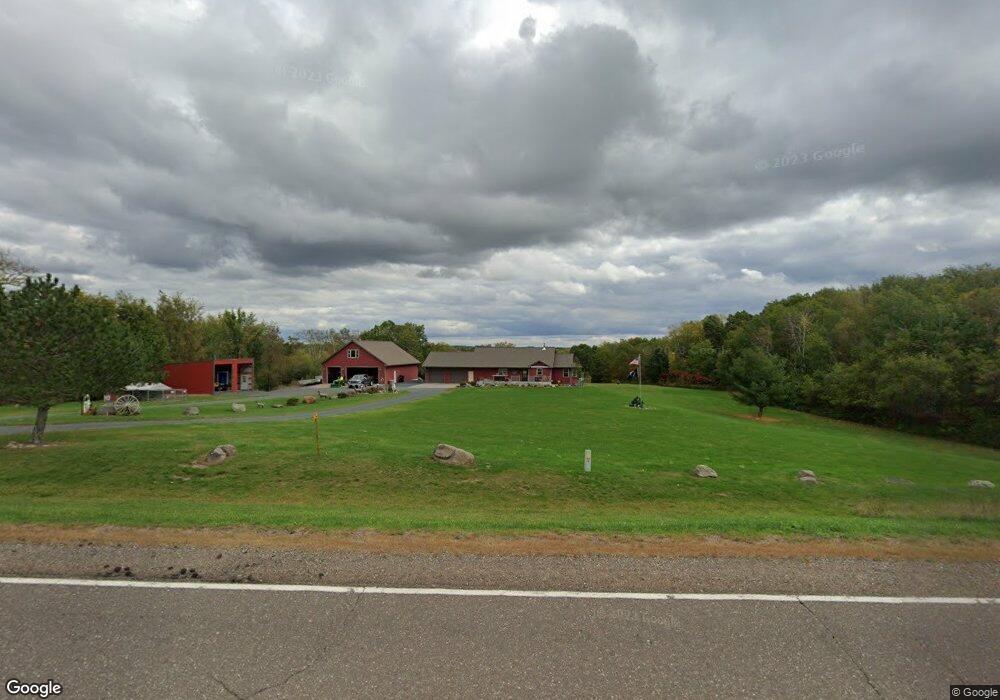
882 190th St Dresser, WI 54009
Estimated Value: $512,000 - $583,740
5
Beds
3
Baths
3,354
Sq Ft
$167/Sq Ft
Est. Value
About This Home
This home is located at 882 190th St, Dresser, WI 54009 and is currently estimated at $559,935, approximately $166 per square foot. 882 190th St is a home located in Polk County with nearby schools including Osceola Elementary School, Osceola Intermediate School, and Osceola Middle School.
Ownership History
Date
Name
Owned For
Owner Type
Purchase Details
Closed on
May 29, 2019
Sold by
Kremer Joint Trt
Bought by
Wallraff Jeremy S
Current Estimated Value
Home Financials for this Owner
Home Financials are based on the most recent Mortgage that was taken out on this home.
Original Mortgage
$200,000
Outstanding Balance
$175,849
Interest Rate
4.1%
Mortgage Type
New Conventional
Estimated Equity
$384,086
Purchase Details
Closed on
Feb 21, 2013
Sold by
Kremer David L and Kremer Tracia A
Bought by
Kremer David L and Kremer Tricia A
Purchase Details
Closed on
Dec 13, 2011
Sold by
Sanoski Ronald James
Bought by
Countrywide Home Loans Servicing Lp
Purchase Details
Closed on
May 11, 2007
Sold by
South Point Inc
Bought by
Sanoski Ronald J
Purchase Details
Closed on
May 10, 2007
Sold by
Wells Fargo Bank National Association As
Bought by
South Point Inc
Purchase Details
Closed on
Dec 19, 2006
Sold by
Anderson David J and Anderson Carolyn
Bought by
Wells Fargo Bank National Association As
Create a Home Valuation Report for This Property
The Home Valuation Report is an in-depth analysis detailing your home's value as well as a comparison with similar homes in the area
Home Values in the Area
Average Home Value in this Area
Purchase History
| Date | Buyer | Sale Price | Title Company |
|---|---|---|---|
| Wallraff Jeremy S | $373,500 | Title One | |
| Kremer David L | -- | -- | |
| Countrywide Home Loans Servicing Lp | -- | -- | |
| Sanoski Ronald J | $218,900 | -- | |
| South Point Inc | $218,900 | -- | |
| Wells Fargo Bank National Association As | $233,400 | -- |
Source: Public Records
Mortgage History
| Date | Status | Borrower | Loan Amount |
|---|---|---|---|
| Open | Wallraff Jeremy S | $200,000 | |
| Closed | Wells Fargo Bank National Association As | $0 |
Source: Public Records
Tax History Compared to Growth
Tax History
| Year | Tax Paid | Tax Assessment Tax Assessment Total Assessment is a certain percentage of the fair market value that is determined by local assessors to be the total taxable value of land and additions on the property. | Land | Improvement |
|---|---|---|---|---|
| 2024 | $4,084 | $490,900 | $49,100 | $441,800 |
| 2023 | $3,991 | $216,500 | $25,000 | $191,500 |
| 2022 | $3,598 | $216,500 | $25,000 | $191,500 |
| 2021 | $3,507 | $216,500 | $25,000 | $191,500 |
| 2020 | $3,387 | $216,500 | $25,000 | $191,500 |
| 2019 | $3,459 | $216,500 | $25,000 | $191,500 |
| 2018 | $3,675 | $213,200 | $21,700 | $191,500 |
| 2017 | $3,233 | $213,200 | $21,700 | $191,500 |
| 2016 | $3,220 | $213,600 | $22,100 | $191,500 |
| 2015 | $3,330 | $231,300 | $25,400 | $205,900 |
| 2013 | $3,506 | $231,300 | $25,400 | $205,900 |
| 2012 | $3,135 | $203,000 | $25,400 | $177,600 |
Source: Public Records
Map
Nearby Homes
- 796 Horse Lake Ln
- 1004 188th St
- 1009 188th St
- 890 207th St
- 2055B 85th Ave
- XXX 85th Ave
- 752 State Road 65
- 1155 200th St
- 1843 60th Ave
- Lot 1 166th St
- Lot 2 166th St
- TBD Wanderoos Rd
- 602 218th St
- 115 E Dresser St
- Lot 73 Roosevelt Dr
- Lot 72 Roosevelt Dr
- 1312 186th St
- 1575 60th Ave Unit K
- 459 Roosevelt Dr
- 435 Garfield St
- 864 190th St
- 904 190th St
- 921 190th St
- 923 190th St
- 1874 93rd Ave
- 1868 93rd Ave
- 1868 93rd Ave
- 839 190th St
- 1864 93rd Ave
- 1858 93rd Ave
- 1960 90th Ave
- 910 195th St
- Lots 10-14 187th St
- 832 190th St
- 947 190th St
- 1850 93rd Ave
- 1848 93rd Ave Unit B
- 1848 93rd Ave
- 945 187th St
- 0 Lot 10 187th St Unit 3491104