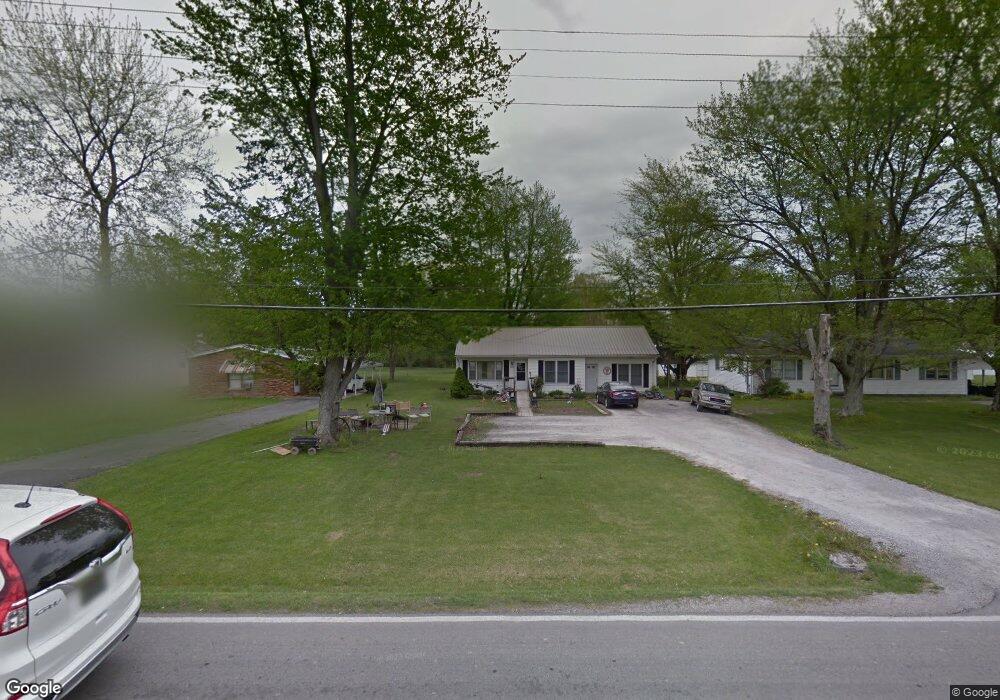
882 Mount Orab Pike Georgetown, OH 45121
Estimated Value: $132,000 - $170,000
4
Beds
1
Bath
1,154
Sq Ft
$130/Sq Ft
Est. Value
About This Home
This home is located at 882 Mount Orab Pike, Georgetown, OH 45121 and is currently estimated at $149,521, approximately $129 per square foot. 882 Mount Orab Pike is a home located in Brown County with nearby schools including Georgetown Elementary School and Georgetown Jr/Sr High School.
Ownership History
Date
Name
Owned For
Owner Type
Purchase Details
Closed on
May 14, 2010
Sold by
Mcmullen Debbie S and Mcmullen Earl L
Bought by
Davis Jack E and Davis Eva Regina
Current Estimated Value
Home Financials for this Owner
Home Financials are based on the most recent Mortgage that was taken out on this home.
Original Mortgage
$38,500
Outstanding Balance
$26,119
Interest Rate
5.3%
Mortgage Type
Unknown
Estimated Equity
$123,402
Purchase Details
Closed on
Apr 23, 2010
Sold by
Root Anita M
Bought by
Mcmullen Debbie S
Home Financials for this Owner
Home Financials are based on the most recent Mortgage that was taken out on this home.
Original Mortgage
$38,500
Outstanding Balance
$26,119
Interest Rate
5.3%
Mortgage Type
Unknown
Estimated Equity
$123,402
Purchase Details
Closed on
Apr 16, 1998
Sold by
Miller Judith A
Bought by
Root Anita M
Home Financials for this Owner
Home Financials are based on the most recent Mortgage that was taken out on this home.
Original Mortgage
$54,400
Interest Rate
7.27%
Mortgage Type
New Conventional
Create a Home Valuation Report for This Property
The Home Valuation Report is an in-depth analysis detailing your home's value as well as a comparison with similar homes in the area
Home Values in the Area
Average Home Value in this Area
Purchase History
| Date | Buyer | Sale Price | Title Company |
|---|---|---|---|
| Davis Jack E | $38,000 | Attorney | |
| Mcmullen Debbie S | $27,000 | None Available | |
| Root Anita M | $68,000 | -- |
Source: Public Records
Mortgage History
| Date | Status | Borrower | Loan Amount |
|---|---|---|---|
| Open | Davis Jack E | $38,500 | |
| Previous Owner | Root Anita M | $54,400 |
Source: Public Records
Tax History Compared to Growth
Tax History
| Year | Tax Paid | Tax Assessment Tax Assessment Total Assessment is a certain percentage of the fair market value that is determined by local assessors to be the total taxable value of land and additions on the property. | Land | Improvement |
|---|---|---|---|---|
| 2024 | $1,156 | $32,620 | $1,620 | $31,000 |
| 2023 | $1,156 | $24,360 | $1,340 | $23,020 |
| 2022 | $939 | $24,360 | $1,340 | $23,020 |
| 2021 | $931 | $24,360 | $1,340 | $23,020 |
| 2020 | $824 | $20,300 | $1,120 | $19,180 |
| 2019 | $818 | $20,300 | $1,120 | $19,180 |
| 2018 | $812 | $20,300 | $1,120 | $19,180 |
| 2017 | $604 | $17,910 | $1,230 | $16,680 |
| 2016 | $603 | $17,910 | $1,230 | $16,680 |
| 2015 | $633 | $17,910 | $1,230 | $16,680 |
| 2014 | $633 | $17,800 | $1,120 | $16,680 |
| 2013 | $631 | $17,800 | $1,120 | $16,680 |
Source: Public Records
Map
Nearby Homes
- 874 Mount Orab Pike
- 427 Kenwood Ave
- 331 Spring Grove Dr
- 508 Mount Orab Pike
- 403 Elmwood Ct
- 401 Elmwood Ct
- 60 New St
- 405 N Main St
- 406 E North St
- 143 Hamer Rd
- 104 Elm St
- 102 Bill Dee Dr
- 306 W 2nd St
- 402 S Pleasant St
- 505 S Water St
- 666 E State St
- 708 E State St
- 418 Home St
- 25 Douglas Ln
- 0 St Rt 221 & Footbridge Unit 1826509
- 888 Mount Orab Pike
- 894 Mount Orab Pike
- 864 Mount Orab Pike
- 20 Powers Ave
- 877 Mount Orab Pike
- 877 Mount Orab Pike
- 7 Hollywood Ln
- 0 Char Del Dr Unit 1594597
- 0 Char Del Dr Unit 492946
- 8 Char Del Dr
- 8 Char Del Dr
- 20 Stephens Ave
- 901 Mount Orab Pike
- 25 Powers Ave
- 25 Powers Ave
- 25 Powers Ave
- 25 Powers Ave
- 24 Stephens Ave
- 4018 Sterling Rd
- 21 Hollywood Ln