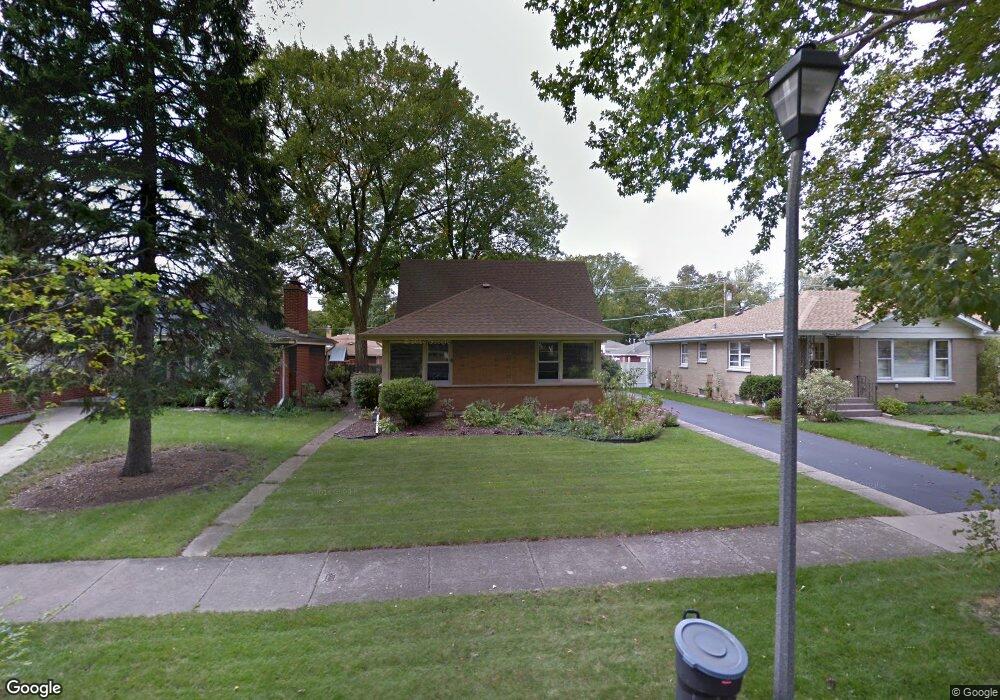
882 S Bryan St Elmhurst, IL 60126
Estimated Value: $558,730 - $649,000
Studio
--
Bath
1,488
Sq Ft
$408/Sq Ft
Est. Value
About This Home
This home is located at 882 S Bryan St, Elmhurst, IL 60126 and is currently estimated at $606,433, approximately $407 per square foot. 882 S Bryan St is a home located in DuPage County with nearby schools including Jackson Elementary School, Bryan Middle School, and York Community High School.
Ownership History
Date
Name
Owned For
Owner Type
Purchase Details
Closed on
Jul 19, 2000
Sold by
Lamprecht Robert W
Bought by
Woodcock David J and Woodcock Maricela Navarro
Current Estimated Value
Home Financials for this Owner
Home Financials are based on the most recent Mortgage that was taken out on this home.
Original Mortgage
$186,000
Outstanding Balance
$64,858
Interest Rate
7.87%
Estimated Equity
$541,575
Create a Home Valuation Report for This Property
The Home Valuation Report is an in-depth analysis detailing your home's value as well as a comparison with similar homes in the area
Home Values in the Area
Average Home Value in this Area
Purchase History
| Date | Buyer | Sale Price | Title Company |
|---|---|---|---|
| Woodcock David J | $292,500 | -- |
Source: Public Records
Mortgage History
| Date | Status | Borrower | Loan Amount |
|---|---|---|---|
| Open | Woodcock David J | $186,000 | |
| Closed | Woodcock David J | $50,450 |
Source: Public Records
Tax History
| Year | Tax Paid | Tax Assessment Tax Assessment Total Assessment is a certain percentage of the fair market value that is determined by local assessors to be the total taxable value of land and additions on the property. | Land | Improvement |
|---|---|---|---|---|
| 2024 | $9,345 | $171,056 | $82,900 | $88,156 |
| 2023 | $8,632 | $158,180 | $76,660 | $81,520 |
| 2022 | $8,552 | $152,040 | $73,680 | $78,360 |
| 2021 | $8,332 | $148,260 | $71,850 | $76,410 |
| 2020 | $8,002 | $145,020 | $70,280 | $74,740 |
| 2019 | $7,815 | $137,880 | $66,820 | $71,060 |
| 2018 | $7,600 | $133,670 | $63,250 | $70,420 |
| 2017 | $7,415 | $127,370 | $60,270 | $67,100 |
| 2016 | $7,235 | $119,990 | $56,780 | $63,210 |
| 2015 | $7,134 | $111,790 | $52,900 | $58,890 |
| 2014 | $7,248 | $105,050 | $42,000 | $63,050 |
| 2013 | $7,176 | $106,530 | $42,590 | $63,940 |
Source: Public Records
Map
Nearby Homes
- 881 S Bryan St
- 878 S Parkside Ave
- 857 S Euclid Ave
- 936 S Mitchell Ave
- 906 S Kirk Ave
- 769 S Prospect Ave
- 182 E Hale St
- 868 S Spring Rd
- 110 W Butterfield Rd Unit 502S
- 875 S York St
- 837 S Kearsage Ave
- 964 S Hillside Ave
- 918 S Cambridge Ave
- 696 S Prospect Ave
- 680 S Bryan St
- 742 S Saylor Ave
- 788 S Cambridge Ave
- 160 E Cayuga Ave
- 927 S Chatham Ave
- 171 E Cayuga Ave
- 886 S Bryan St
- 878 S Bryan St
- 890 S Bryan St
- 872 S Bryan St
- 881 S Parkside Ave
- 885 S Parkside Ave
- 875 S Parkside Ave
- 894 S Bryan St
- 889 S Parkside Ave
- 150 W Jackson St
- 871 S Parkside Ave
- 875 S Bryan St
- 885 S Bryan St
- 170 W Jackson St
- 898 S Bryan St
- 871 S Bryan St
- 891 S Bryan St
- 899 S Parkside Ave
- 134 W Jackson St
- 902 S Bryan St
Your Personal Tour Guide
Ask me questions while you tour the home.