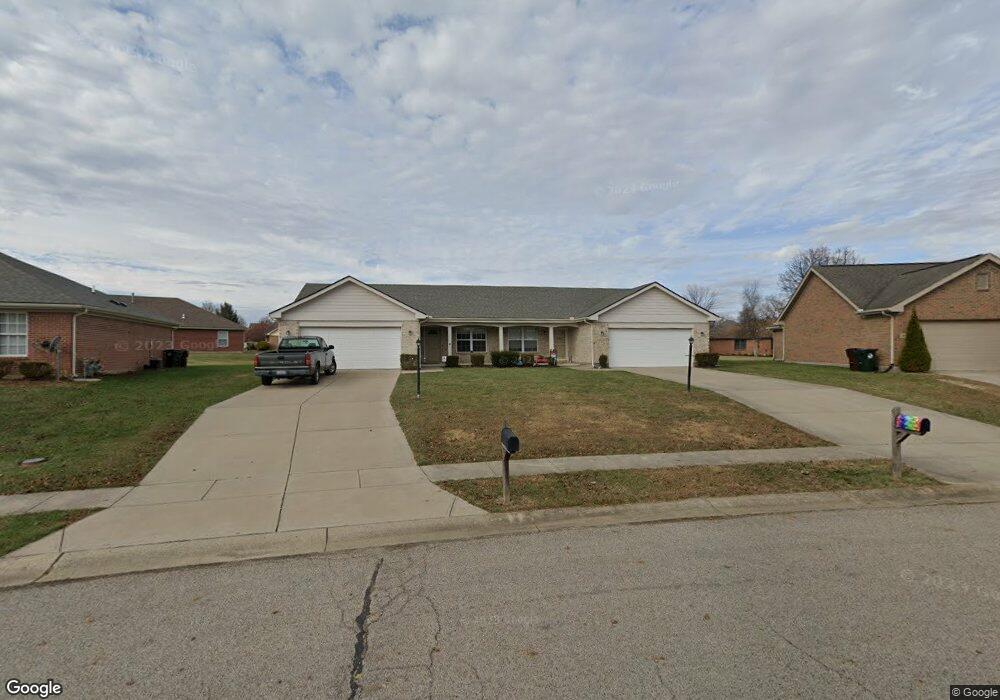
882 Windfield Way Waynesville, OH 45068
Wayne Township NeighborhoodEstimated Value: $319,000 - $397,000
6
Beds
4
Baths
2,661
Sq Ft
$138/Sq Ft
Est. Value
About This Home
This home is located at 882 Windfield Way, Waynesville, OH 45068 and is currently estimated at $366,809, approximately $137 per square foot. 882 Windfield Way is a home located in Warren County with nearby schools including Waynesville Elementary School, Waynesville Middle School, and Waynesville High School.
Ownership History
Date
Name
Owned For
Owner Type
Purchase Details
Closed on
Nov 5, 2004
Sold by
Moorman T R and Moorman Teresa
Bought by
Wood Edward E
Current Estimated Value
Home Financials for this Owner
Home Financials are based on the most recent Mortgage that was taken out on this home.
Original Mortgage
$127,890
Outstanding Balance
$63,694
Interest Rate
5.75%
Mortgage Type
Purchase Money Mortgage
Estimated Equity
$303,115
Purchase Details
Closed on
Jan 28, 2003
Sold by
Carter Thomas
Bought by
Moorman T R
Home Financials for this Owner
Home Financials are based on the most recent Mortgage that was taken out on this home.
Original Mortgage
$36,500
Interest Rate
6.13%
Mortgage Type
New Conventional
Purchase Details
Closed on
Jul 9, 1993
Sold by
Wright Donald C and Wright Shank
Bought by
Carter and Carter Thomas W
Purchase Details
Closed on
May 19, 1993
Sold by
Wright Donald C and Wright Shanks
Bought by
Wright and Wright Donald C
Create a Home Valuation Report for This Property
The Home Valuation Report is an in-depth analysis detailing your home's value as well as a comparison with similar homes in the area
Home Values in the Area
Average Home Value in this Area
Purchase History
| Date | Buyer | Sale Price | Title Company |
|---|---|---|---|
| Wood Edward E | $37,000 | Midwest Abstract Company | |
| Moorman T R | $36,500 | -- | |
| Carter | $25,000 | -- | |
| Wright | -- | -- |
Source: Public Records
Mortgage History
| Date | Status | Borrower | Loan Amount |
|---|---|---|---|
| Open | Wood Edward E | $127,890 | |
| Previous Owner | Moorman T R | $36,500 |
Source: Public Records
Tax History Compared to Growth
Tax History
| Year | Tax Paid | Tax Assessment Tax Assessment Total Assessment is a certain percentage of the fair market value that is determined by local assessors to be the total taxable value of land and additions on the property. | Land | Improvement |
|---|---|---|---|---|
| 2024 | $4,472 | $99,650 | $12,600 | $87,050 |
| 2023 | $4,212 | $81,448 | $13,608 | $67,840 |
| 2022 | $4,130 | $81,449 | $13,608 | $67,841 |
| 2021 | $3,977 | $81,449 | $13,608 | $67,841 |
| 2020 | $4,287 | $75,415 | $12,600 | $62,815 |
| 2019 | $4,289 | $75,415 | $12,600 | $62,815 |
| 2018 | $4,291 | $75,415 | $12,600 | $62,815 |
| 2017 | $4,080 | $66,945 | $11,372 | $55,573 |
| 2016 | $3,844 | $66,945 | $11,372 | $55,573 |
| 2015 | $3,852 | $66,945 | $11,372 | $55,573 |
| 2014 | $4,075 | $66,940 | $11,370 | $55,570 |
| 2013 | $4,069 | $74,180 | $12,600 | $61,580 |
Source: Public Records
Map
Nearby Homes
- 1198 Lytle Rd
- 1106 Lytle Rd
- 1036 Bayberry Dr
- 1106 Brookfield Dr Unit 1106
- 60 E Ellis Dr
- 363 Victoria Place
- 460 Miami St
- 350 Somerset Ln
- 53 S 4th St
- 437 N Main St
- 196 S 3rd St
- 1 Cumberland Ct
- 155 S Main St
- 7219 N Route 42
- 0 Ohio 73 Unit 944080
- 7219 U S 42
- 401 Wilkerson Ln
- 7219 N Us Rt 42
- 127 New Burlington Rd
- 3950 E State Route 73
- 872 Windfield Way
- 892 Windfield Way
- 960 Brookfield Dr
- 972 Brookfield Dr
- 972 Brookfield Dr Unit A
- 897 Camp Creek Rd
- 875 Camp Creek Rd
- 903 Camp Creek Rd
- 862 Windfield Way
- 865 Windfield Way
- 977 Brookfield Dr
- 977 Brookfield Dr Unit 979
- 912 Windfield Way
- 855 Camp Creek Rd
- 917 Camp Creek Rd
- 982 Brookfield Dr
- 885 Windfield Way
- 905 Windfield Way
- 984 Brookfield Dr
- 835 Camp Creek Rd