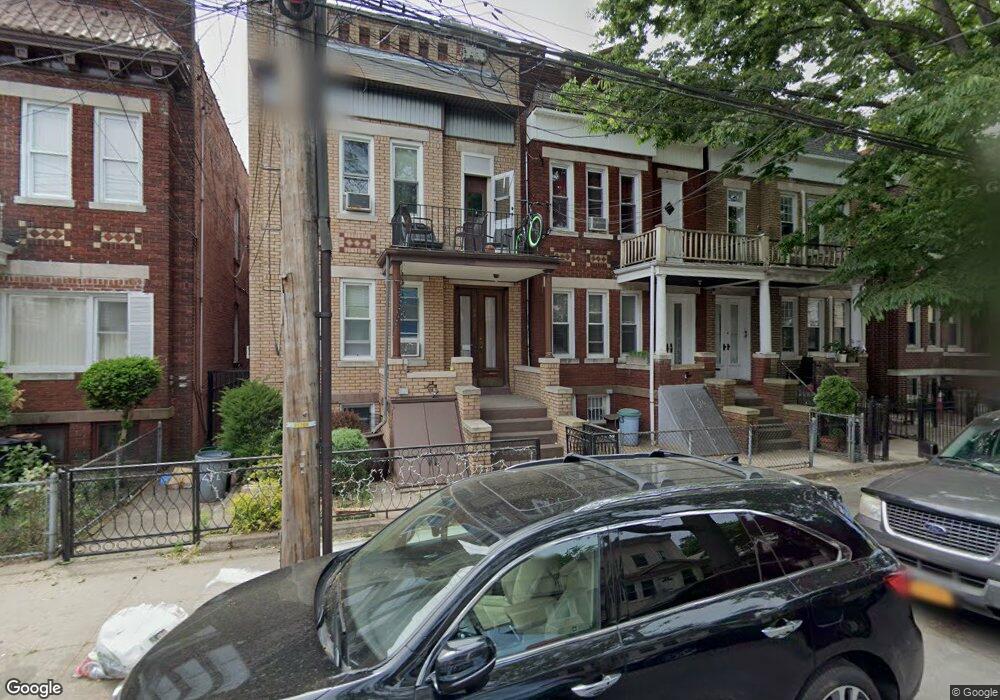
8820 86th St Woodhaven, NY 11421
Woodhaven NeighborhoodEstimated Value: $815,000 - $940,000
--
Bed
--
Bath
2,090
Sq Ft
$421/Sq Ft
Est. Value
About This Home
This home is located at 8820 86th St, Woodhaven, NY 11421 and is currently estimated at $879,931, approximately $421 per square foot. 8820 86th St is a home located in Queens County with nearby schools including P.S. 060 Woodhaven, Alice Ott Middle School, and Jhs 210 Elizabeth Blackwell.
Ownership History
Date
Name
Owned For
Owner Type
Purchase Details
Closed on
Feb 13, 2018
Sold by
Estate Of Serge Martineau
Bought by
Joshi Sunil and Rimal Bhattrai Tara
Current Estimated Value
Purchase Details
Closed on
Jun 27, 1996
Sold by
Zilvetiz Juan G and Zilvetiz Hanna
Bought by
Lin Hao Chung and Lin Su Juan
Home Financials for this Owner
Home Financials are based on the most recent Mortgage that was taken out on this home.
Original Mortgage
$80,000
Interest Rate
8.27%
Create a Home Valuation Report for This Property
The Home Valuation Report is an in-depth analysis detailing your home's value as well as a comparison with similar homes in the area
Home Values in the Area
Average Home Value in this Area
Purchase History
| Date | Buyer | Sale Price | Title Company |
|---|---|---|---|
| Joshi Sunil | $119,000 | -- | |
| Lin Hao Chung | $175,000 | Commonwealth Land Title Ins |
Source: Public Records
Mortgage History
| Date | Status | Borrower | Loan Amount |
|---|---|---|---|
| Previous Owner | Lin Hao Chung | $80,000 |
Source: Public Records
Tax History Compared to Growth
Tax History
| Year | Tax Paid | Tax Assessment Tax Assessment Total Assessment is a certain percentage of the fair market value that is determined by local assessors to be the total taxable value of land and additions on the property. | Land | Improvement |
|---|---|---|---|---|
| 2025 | $6,541 | $35,971 | $9,595 | $26,376 |
| 2024 | $6,553 | $33,966 | $8,511 | $25,455 |
| 2023 | $6,521 | $33,869 | $8,772 | $25,097 |
| 2022 | $6,252 | $54,300 | $13,380 | $40,920 |
| 2021 | $6,323 | $49,680 | $13,380 | $36,300 |
| 2020 | $6,049 | $48,240 | $13,380 | $34,860 |
| 2019 | $5,628 | $47,280 | $13,380 | $33,900 |
| 2018 | $5,456 | $28,224 | $10,759 | $17,465 |
| 2017 | $5,178 | $26,872 | $10,955 | $15,917 |
| 2016 | $4,929 | $26,872 | $10,955 | $15,917 |
| 2015 | $2,838 | $24,980 | $13,153 | $11,827 |
| 2014 | $2,838 | $23,588 | $13,862 | $9,726 |
Source: Public Records
Map
Nearby Homes