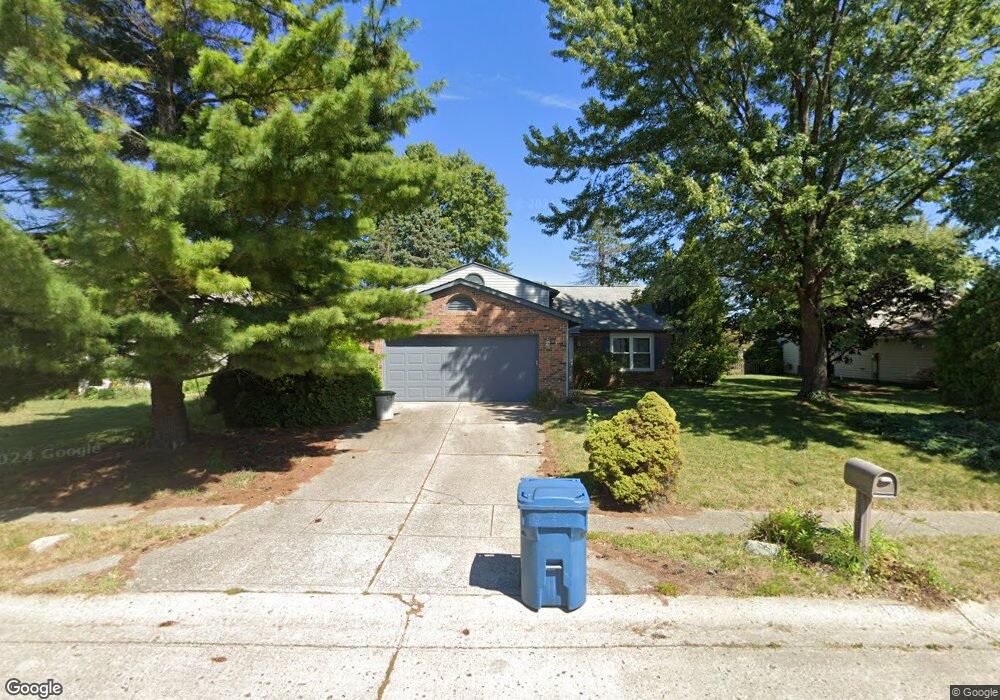
8820 Appleby Ln Indianapolis, IN 46256
I-69 Fall Creek NeighborhoodEstimated Value: $304,000 - $331,000
3
Beds
3
Baths
1,780
Sq Ft
$177/Sq Ft
Est. Value
About This Home
This home is located at 8820 Appleby Ln, Indianapolis, IN 46256 and is currently estimated at $315,015, approximately $176 per square foot. 8820 Appleby Ln is a home located in Marion County with nearby schools including Mary Evelyn Castle Elementary School, Fall Creek Valley Middle School, and Lawrence North High School.
Ownership History
Date
Name
Owned For
Owner Type
Purchase Details
Closed on
Jul 12, 2007
Sold by
Young Carol
Bought by
Donovan Brian P
Current Estimated Value
Home Financials for this Owner
Home Financials are based on the most recent Mortgage that was taken out on this home.
Original Mortgage
$110,400
Outstanding Balance
$66,742
Interest Rate
6.42%
Mortgage Type
New Conventional
Estimated Equity
$248,273
Create a Home Valuation Report for This Property
The Home Valuation Report is an in-depth analysis detailing your home's value as well as a comparison with similar homes in the area
Home Values in the Area
Average Home Value in this Area
Purchase History
| Date | Buyer | Sale Price | Title Company |
|---|---|---|---|
| Donovan Brian P | -- | None Available |
Source: Public Records
Mortgage History
| Date | Status | Borrower | Loan Amount |
|---|---|---|---|
| Open | Donovan Brian P | $110,400 |
Source: Public Records
Tax History
| Year | Tax Paid | Tax Assessment Tax Assessment Total Assessment is a certain percentage of the fair market value that is determined by local assessors to be the total taxable value of land and additions on the property. | Land | Improvement |
|---|---|---|---|---|
| 2025 | $2,988 | $269,300 | $43,300 | $226,000 |
| 2024 | $2,906 | $273,700 | $43,300 | $230,400 |
| 2023 | $2,906 | $259,700 | $43,300 | $216,400 |
| 2022 | $2,735 | $242,700 | $43,300 | $199,400 |
| 2021 | $2,352 | $204,400 | $25,400 | $179,000 |
| 2020 | $2,171 | $186,900 | $25,400 | $161,500 |
| 2019 | $1,806 | $172,500 | $25,400 | $147,100 |
| 2018 | $1,801 | $172,200 | $25,400 | $146,800 |
| 2017 | $1,664 | $158,700 | $25,400 | $133,300 |
| 2016 | $1,610 | $153,500 | $25,400 | $128,100 |
| 2014 | $1,444 | $145,500 | $25,400 | $120,100 |
| 2013 | $1,445 | $144,500 | $25,400 | $119,100 |
Source: Public Records
Map
Nearby Homes
- 8731 Ginnylock Dr
- 8815 Burwick Dr
- 8880 Burwick Dr
- 9233 Champton Dr
- 8733 Caplock Ln
- 8953 Pine Tree Blvd
- 8953 Baywood Cir
- 8902 Pine Tree Blvd
- 9020 Split Tree Ct
- 8868 Pine Tree Blvd
- 8547 Rock Hollow Cir
- 8574 Woodstone Ct
- 8889 White Fir Dr
- 8545 Woodstone Ct
- 8820 Deer Run Ct
- 8833 Deer Run Ct
- 9725 Covington Blvd
- 8999 Kiser Point
- 9049 Lisering Cir
- 8605 E 86th St
- 8810 Appleby Ln
- 8830 Appleby Ln
- 8758 Appleby Ln
- 8840 Appleby Ln
- 8821 Appleby Ln
- 8811 Appleby Ln
- 8831 Appleby Ln
- 8779 Buckhaven Dr
- 8850 Appleby Ln
- 8873 Buckhaven Dr
- 8748 Appleby Ln
- 8841 Appleby Ln
- 8815 Buckhaven Dr
- 8853 Buckhaven Dr
- 8759 Appleby Ln
- 8765 Buckhaven Dr
- 8863 Buckhaven Dr
- 8883 Buckhaven Dr
- 8749 Appleby Ln
- 8812 Ginnylock Dr
Your Personal Tour Guide
Ask me questions while you tour the home.