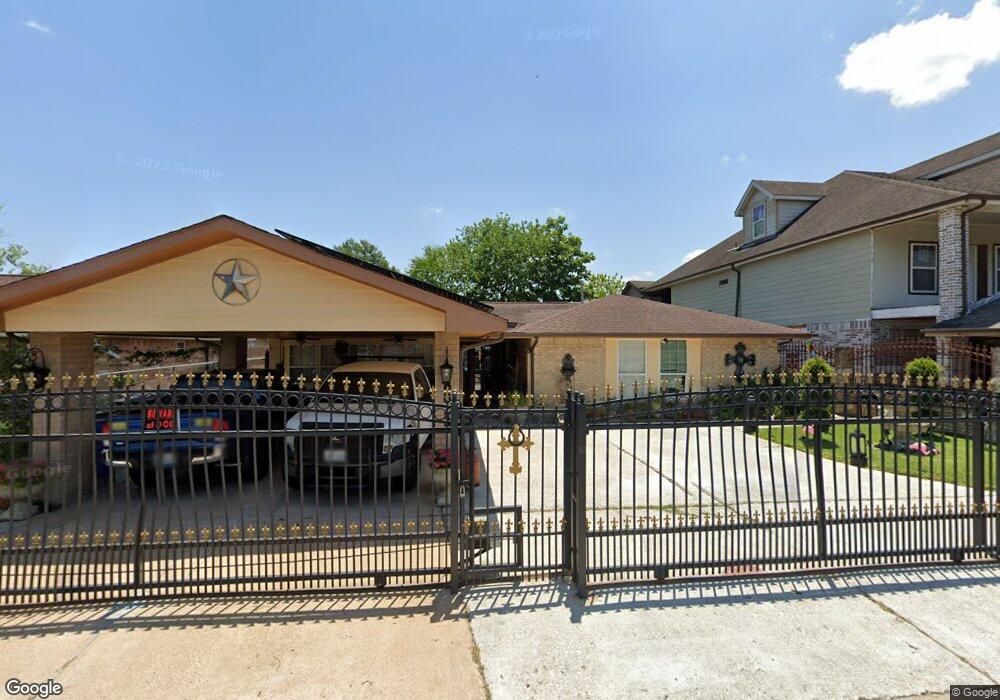
8822 Donley Dr Houston, TX 77088
Acres Homes NeighborhoodEstimated Value: $207,000 - $249,000
3
Beds
2
Baths
1,470
Sq Ft
$153/Sq Ft
Est. Value
About This Home
This home is located at 8822 Donley Dr, Houston, TX 77088 and is currently estimated at $224,762, approximately $152 per square foot. 8822 Donley Dr is a home located in Harris County with nearby schools including Hill Intermediate School, Stovall School, and Dr. Viola K. Garcia Middle School.
Ownership History
Date
Name
Owned For
Owner Type
Purchase Details
Closed on
Nov 22, 2017
Sold by
Moya Alejandro and Carmona Aleida
Bought by
Sandoval Juan M
Current Estimated Value
Home Financials for this Owner
Home Financials are based on the most recent Mortgage that was taken out on this home.
Original Mortgage
$118,000
Outstanding Balance
$99,035
Interest Rate
3.91%
Mortgage Type
New Conventional
Estimated Equity
$125,727
Purchase Details
Closed on
May 2, 2013
Sold by
Forefront Medical Devices Inc
Bought by
Moya Alejandro and Carmona Aleida
Purchase Details
Closed on
Apr 9, 2013
Sold by
Wilson Eusephia J
Bought by
Forefront Medical Devices Inc
Purchase Details
Closed on
Apr 20, 1995
Sold by
Baker Isaac Bruce and Baker Patrina C
Bought by
Wilson Eusephia J
Home Financials for this Owner
Home Financials are based on the most recent Mortgage that was taken out on this home.
Original Mortgage
$43,988
Interest Rate
8.53%
Mortgage Type
Seller Take Back
Create a Home Valuation Report for This Property
The Home Valuation Report is an in-depth analysis detailing your home's value as well as a comparison with similar homes in the area
Home Values in the Area
Average Home Value in this Area
Purchase History
| Date | Buyer | Sale Price | Title Company |
|---|---|---|---|
| Sandoval Juan M | -- | North Star Title Co | |
| Moya Alejandro | -- | None Available | |
| Forefront Medical Devices Inc | $20,100 | None Available | |
| Wilson Eusephia J | -- | Heritage Title Company |
Source: Public Records
Mortgage History
| Date | Status | Borrower | Loan Amount |
|---|---|---|---|
| Open | Sandoval Juan M | $118,000 | |
| Previous Owner | Wilson Eusephia J | $43,988 |
Source: Public Records
Tax History Compared to Growth
Tax History
| Year | Tax Paid | Tax Assessment Tax Assessment Total Assessment is a certain percentage of the fair market value that is determined by local assessors to be the total taxable value of land and additions on the property. | Land | Improvement |
|---|---|---|---|---|
| 2025 | $2,619 | $265,199 | $55,800 | $209,399 |
| 2024 | $2,619 | $255,071 | $35,960 | $219,111 |
| 2023 | $2,619 | $255,071 | $35,960 | $219,111 |
| 2022 | $4,127 | $235,647 | $31,000 | $204,647 |
| 2021 | $3,929 | $210,603 | $31,000 | $179,603 |
| 2020 | $3,121 | $131,276 | $31,000 | $100,276 |
| 2019 | $2,975 | $113,400 | $11,160 | $102,240 |
| 2018 | $1,044 | $97,734 | $11,160 | $86,574 |
| 2017 | $2,593 | $97,734 | $11,160 | $86,574 |
| 2016 | $2,593 | $97,734 | $11,160 | $86,574 |
| 2015 | $1,510 | $77,881 | $11,160 | $66,721 |
| 2014 | $1,510 | $56,758 | $11,160 | $45,598 |
Source: Public Records
Map
Nearby Homes
- 8835 Glenhouse Dr
- 1806 Saddle Rock Dr Unit 770
- 1707 Winter Bay Ln
- 1907 Bunzel St
- 1710 Beaver Bend Rd
- 2003 Deerhurst Ln
- 1615 Mosher Ln
- 9208 Ab Wheatley St
- 8615 Citation Ct
- 9206 Ab Wheatley St
- 9722 Willow
- 9010 Wheatley St
- 1330 Mosher Ln
- 2110 Mosher Ln
- 1826 Dewalt St
- 2018 Dewalt St
- 1054 Dewalt St
- 9534 Irby St
- 2146 Twinbrooke Dr
- 1203 Dewalt St
- 8818 Donley Dr
- 8826 Donley Dr
- 8823 Glenhouse Dr
- 8827 Glenhouse Dr
- 8819 Glenhouse Dr
- 8814 Donley Dr
- 8830 Donley Dr
- 8831 Glenhouse Dr
- 8823 Donley Dr
- 8827 Donley Dr
- 8819 Donley Dr
- 8834 Donley Dr
- 8815 Glenhouse Dr
- 8831 Donley Dr Unit 770
- 8810 Donley Dr
- 8815 Donley Dr
- 8835 Donley Dr Unit 770
- 8838 Donley Dr
- 8826 Glenhouse Dr
- 8839 Glenhouse Dr