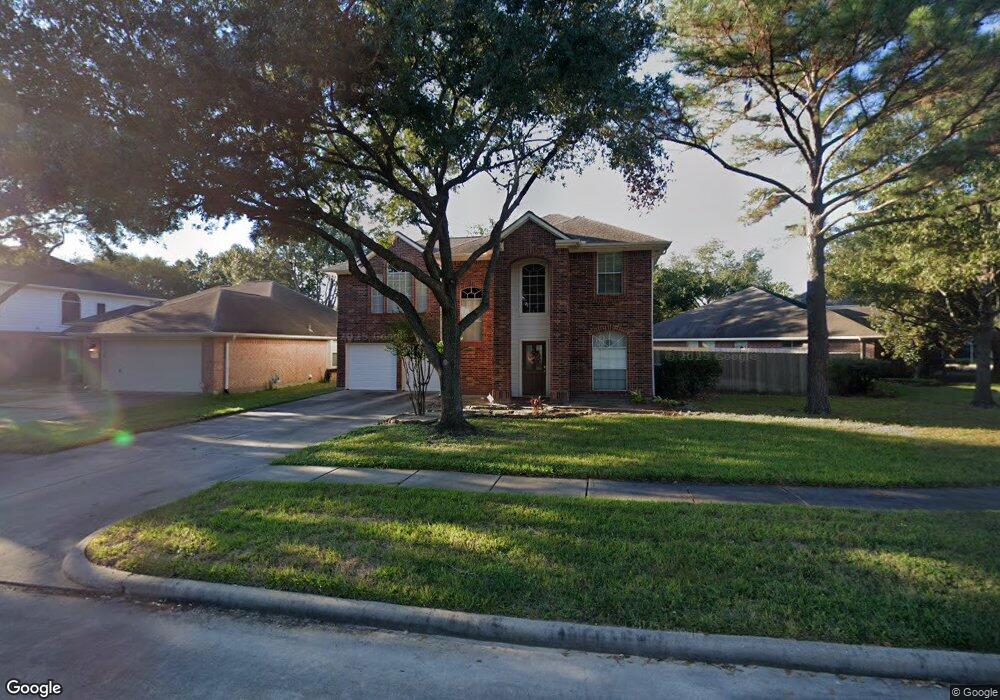
8823 Sherina Park Dr Houston, TX 77095
Estimated Value: $310,261 - $345,000
3
Beds
3
Baths
2,166
Sq Ft
$152/Sq Ft
Est. Value
About This Home
This home is located at 8823 Sherina Park Dr, Houston, TX 77095 and is currently estimated at $328,565, approximately $151 per square foot. 8823 Sherina Park Dr is a home located in Harris County with nearby schools including Birkes Elementary School, Labay Middle School, and Cypress Falls High School.
Ownership History
Date
Name
Owned For
Owner Type
Purchase Details
Closed on
May 4, 2005
Sold by
Weeks Robert A and Weeks Stacie
Bought by
Moss Stephanie R
Current Estimated Value
Home Financials for this Owner
Home Financials are based on the most recent Mortgage that was taken out on this home.
Original Mortgage
$109,810
Outstanding Balance
$58,063
Interest Rate
6.06%
Mortgage Type
Fannie Mae Freddie Mac
Estimated Equity
$270,502
Purchase Details
Closed on
Jul 3, 1996
Sold by
George Wimpey Of Texas Inc
Bought by
Weeks Robert A and Weeks Stacie
Home Financials for this Owner
Home Financials are based on the most recent Mortgage that was taken out on this home.
Original Mortgage
$100,300
Interest Rate
8.02%
Create a Home Valuation Report for This Property
The Home Valuation Report is an in-depth analysis detailing your home's value as well as a comparison with similar homes in the area
Home Values in the Area
Average Home Value in this Area
Purchase History
| Date | Buyer | Sale Price | Title Company |
|---|---|---|---|
| Moss Stephanie R | -- | Stewart Title Houston Div | |
| Weeks Robert A | -- | American Title Company |
Source: Public Records
Mortgage History
| Date | Status | Borrower | Loan Amount |
|---|---|---|---|
| Open | Moss Stephanie R | $109,810 | |
| Previous Owner | Weeks Robert A | $100,300 |
Source: Public Records
Tax History Compared to Growth
Tax History
| Year | Tax Paid | Tax Assessment Tax Assessment Total Assessment is a certain percentage of the fair market value that is determined by local assessors to be the total taxable value of land and additions on the property. | Land | Improvement |
|---|---|---|---|---|
| 2025 | $4,171 | $285,717 | $65,203 | $220,514 |
| 2024 | $4,171 | $288,913 | $65,203 | $223,710 |
| 2023 | $4,171 | $285,970 | $65,203 | $220,767 |
| 2022 | $5,669 | $268,582 | $50,048 | $218,534 |
| 2021 | $5,455 | $210,525 | $50,048 | $160,477 |
| 2020 | $5,563 | $206,084 | $41,589 | $164,495 |
| 2019 | $5,357 | $192,664 | $29,606 | $163,058 |
| 2018 | $1,824 | $189,603 | $29,606 | $159,997 |
| 2017 | $5,302 | $189,603 | $29,606 | $159,997 |
| 2016 | $4,900 | $175,247 | $29,606 | $145,641 |
| 2015 | $3,478 | $175,247 | $29,606 | $145,641 |
| 2014 | $3,478 | $150,650 | $24,672 | $125,978 |
Source: Public Records
Map
Nearby Homes
- 8814 Sherina Park Dr
- 16111 Aberdeen Forest Dr
- 16123 Aberdeen Forest Dr
- 15906 Marwick Ct
- 8818 Apple Mill Dr
- 16211 Green Smoke Dr
- 8835 Aberdeen Park Dr
- 15802 Aberdeen Trails Dr
- 8550 Sparkling Springs Dr
- 15735 Jamie Lee Dr
- 15954 Oak Mountain Dr
- 9138 Shango Ln
- 8806 Gas Light Village Dr
- 8550 Waiting Spring Ln
- 9111 Sunny Ridge Dr
- 8306 Lake Crystal Dr
- 8426 Laurel Trails Dr
- 8526 Greenleaf Lake Dr
- 9203 Appin Ct
- 9207 Appin Ct
- 8831 Sherina Park Dr
- 8815 Sherina Park Dr
- 8811 Sherina Park Dr
- 8839 Sherina Park Dr
- 8918 Aberdeen Oaks Dr
- 8914 Aberdeen Oaks Dr
- 8818 Sherina Park Dr
- 8807 Sherina Park Dr
- 8826 Sherina Park Dr
- 8843 Sherina Park Dr
- 8910 Aberdeen Oaks Dr
- 8822 Sherina Park Dr
- 8830 Sherina Park Dr
- 8810 Sherina Park Dr
- 8834 Sherina Park Dr
- 8806 Sherina Park Dr
- 8906 Aberdeen Oaks Dr
- 8803 Sherina Park Dr
- 8838 Sherina Park Dr
- 8934 Aberdeen Oaks Dr