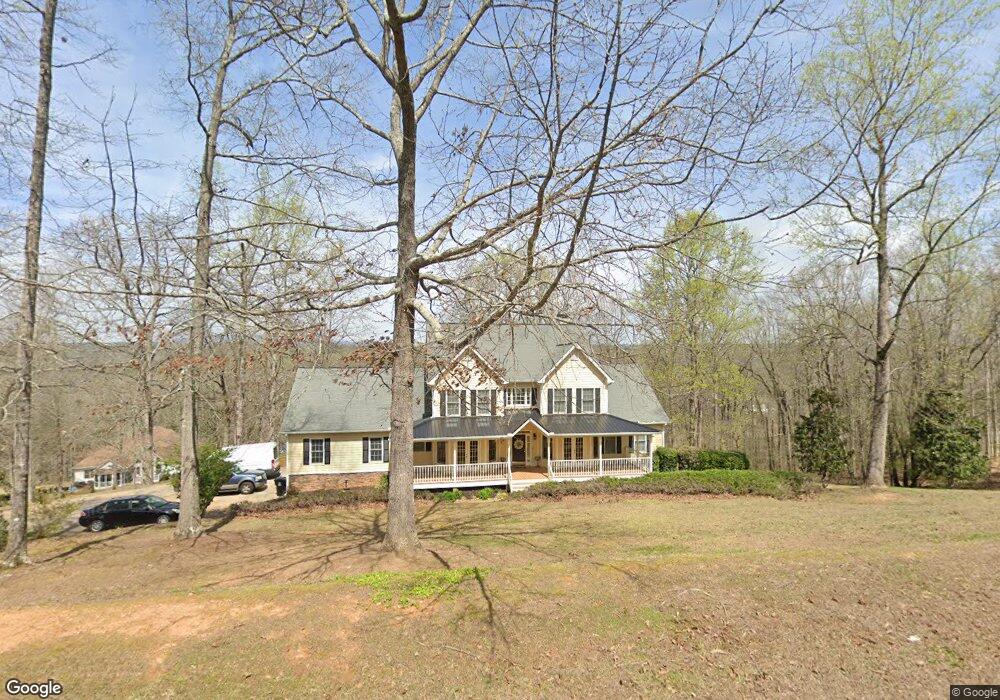
8825 Saddle Trail Ball Ground, GA 30107
Estimated Value: $687,245 - $848,000
4
Beds
4
Baths
3,180
Sq Ft
$240/Sq Ft
Est. Value
About This Home
This home is located at 8825 Saddle Trail, Ball Ground, GA 30107 and is currently estimated at $762,061, approximately $239 per square foot. 8825 Saddle Trail is a home located in Forsyth County with nearby schools including Poole's Mill Elementary School, Liberty Middle School, and North Forsyth High School.
Ownership History
Date
Name
Owned For
Owner Type
Purchase Details
Closed on
Sep 26, 2003
Sold by
Branch Banking & Trust Co
Bought by
Burns Daniel T and Burns Linda
Current Estimated Value
Home Financials for this Owner
Home Financials are based on the most recent Mortgage that was taken out on this home.
Original Mortgage
$270,000
Outstanding Balance
$108,878
Interest Rate
4.25%
Mortgage Type
New Conventional
Estimated Equity
$653,183
Purchase Details
Closed on
Jul 1, 2003
Sold by
Garner Richard K and Garner Dianne T
Bought by
Branch Banking/Trust Co
Purchase Details
Closed on
Jan 23, 1998
Sold by
Kieffer Design & Const
Bought by
Garner Richard K and Garner Dianne T
Home Financials for this Owner
Home Financials are based on the most recent Mortgage that was taken out on this home.
Original Mortgage
$206,000
Interest Rate
7.07%
Mortgage Type
New Conventional
Create a Home Valuation Report for This Property
The Home Valuation Report is an in-depth analysis detailing your home's value as well as a comparison with similar homes in the area
Home Values in the Area
Average Home Value in this Area
Purchase History
| Date | Buyer | Sale Price | Title Company |
|---|---|---|---|
| Burns Daniel T | $337,500 | -- | |
| Branch Banking/Trust Co | $317,925 | -- | |
| Garner Richard K | $306,000 | -- |
Source: Public Records
Mortgage History
| Date | Status | Borrower | Loan Amount |
|---|---|---|---|
| Open | Burns Daniel T | $270,000 | |
| Previous Owner | Garner Richard K | $206,000 |
Source: Public Records
Tax History Compared to Growth
Tax History
| Year | Tax Paid | Tax Assessment Tax Assessment Total Assessment is a certain percentage of the fair market value that is determined by local assessors to be the total taxable value of land and additions on the property. | Land | Improvement |
|---|---|---|---|---|
| 2025 | $1,079 | $311,636 | $59,812 | $251,824 |
| 2024 | $1,079 | $252,652 | $60,960 | $191,692 |
| 2023 | $968 | $224,348 | $60,156 | $164,192 |
| 2022 | $4,966 | $190,068 | $29,820 | $160,248 |
| 2021 | $4,775 | $190,068 | $29,820 | $160,248 |
| 2020 | $4,316 | $167,852 | $29,820 | $138,032 |
| 2019 | $4,578 | $180,160 | $29,820 | $150,340 |
| 2018 | $4,567 | $178,788 | $29,820 | $148,968 |
| 2017 | $4,154 | $158,404 | $29,820 | $128,584 |
| 2016 | $4,037 | $152,844 | $29,820 | $123,024 |
| 2015 | $3,468 | $127,864 | $17,040 | $110,824 |
| 2014 | $2,902 | $112,892 | $17,040 | $95,852 |
Source: Public Records
Map
Nearby Homes
- 8965 Saddle Trail
- 8010 Scudder Way
- 8850 Matt Hwy
- 8910 Champion Ct
- 8915 Avonbrook Close
- Trenton Plan at Stratford Hills
- Sumner Plan at Stratford Hills
- Stockbridge Plan at Stratford Hills
- Kenwood Plan at Stratford Hills
- Essex Plan at Stratford Hills
- Ingram Plan at Stratford Hills
- Lawrence Plan at Stratford Hills
- Kirkwood Plan at Stratford Hills
- Easton Plan at Stratford Hills
- Aiken Plan at Stratford Hills
- 8680 Stratford Oaks Ave
- 8625 Standing Stone
- The Dawson Plan at River Rock
- The Carden Plan at River Rock
- The Elizabeth Plan at River Rock
- 0 Saddle Trail Unit 7488196
- 0 Saddle Trail Unit 7177463
- 0 Saddle Trail Unit 3143307
- 0 Saddle Trail Unit 8837182
- 0 Saddle Trail Unit 8576348
- 0 Saddle Trail Unit 8429323
- 0 Saddle Trail Unit 8016219
- 0 Saddle Trail Unit 7596196
- 0 Saddle Trail Unit 7558609
- 0 Saddle Trail Unit 7559194
- 0 Saddle Trail Unit 2674302
- 0 Saddle Trail Unit 7124072
- 0 Saddle Trail Unit 8067876
- 0 Saddle Trail Unit 7413761
- 8955 Saddle Trail
- 8815 Saddle Trail
- 8835 Saddle Trail
- 8820 Saddle Trail
- 8935 Saddle Trail
- 8805 Saddle Trail