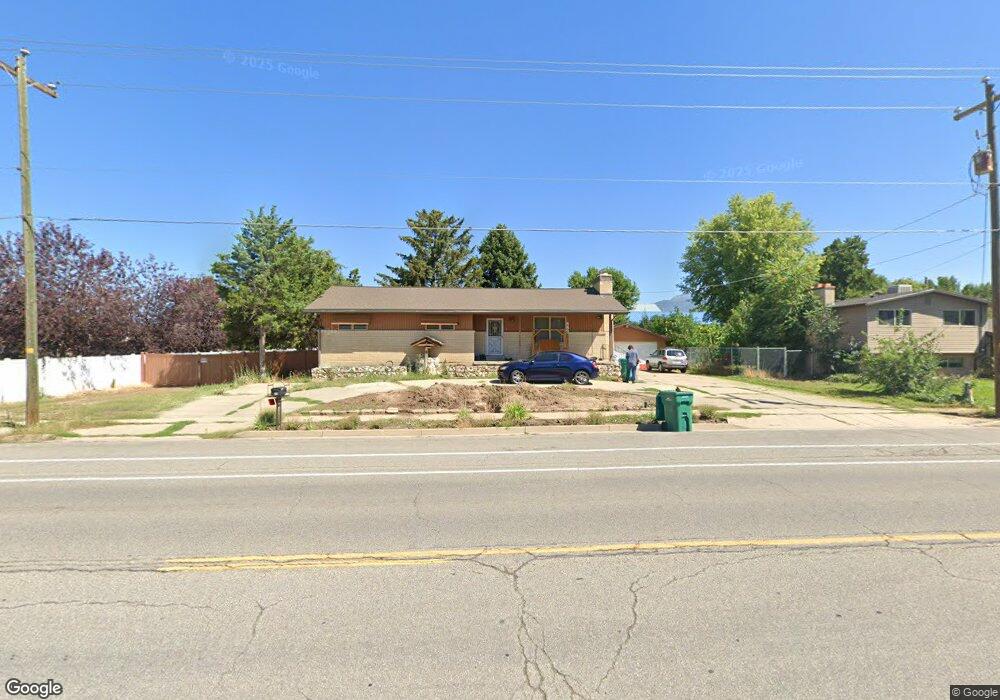
883 E 2000 N Layton, UT 84040
Estimated Value: $555,000 - $616,000
4
Beds
3
Baths
2,712
Sq Ft
$219/Sq Ft
Est. Value
About This Home
This home is located at 883 E 2000 N, Layton, UT 84040 and is currently estimated at $593,671, approximately $218 per square foot. 883 E 2000 N is a home located in Davis County with nearby schools including Sarah Jane Adams Elementary School, North Layton Junior High School, and Northridge High School.
Ownership History
Date
Name
Owned For
Owner Type
Purchase Details
Closed on
Feb 22, 2019
Sold by
Almeida Morgan Joseph R and Almeida Morgan Chincia
Bought by
Scott Richard and Scott Beth
Current Estimated Value
Home Financials for this Owner
Home Financials are based on the most recent Mortgage that was taken out on this home.
Original Mortgage
$370,000
Outstanding Balance
$324,633
Interest Rate
4.4%
Mortgage Type
VA
Estimated Equity
$269,038
Purchase Details
Closed on
Apr 12, 2013
Sold by
Cox J Beverly
Bought by
Morgan Joseph R and Morgan Chincia Almeida
Home Financials for this Owner
Home Financials are based on the most recent Mortgage that was taken out on this home.
Original Mortgage
$211,105
Interest Rate
3.62%
Mortgage Type
FHA
Create a Home Valuation Report for This Property
The Home Valuation Report is an in-depth analysis detailing your home's value as well as a comparison with similar homes in the area
Home Values in the Area
Average Home Value in this Area
Purchase History
| Date | Buyer | Sale Price | Title Company |
|---|---|---|---|
| Scott Richard | -- | Us Title Company Of | |
| Morgan Joseph R | -- | Backman Title Servic |
Source: Public Records
Mortgage History
| Date | Status | Borrower | Loan Amount |
|---|---|---|---|
| Open | Scott Richard | $370,000 | |
| Previous Owner | Morgan Joseph R | $211,105 |
Source: Public Records
Tax History
| Year | Tax Paid | Tax Assessment Tax Assessment Total Assessment is a certain percentage of the fair market value that is determined by local assessors to be the total taxable value of land and additions on the property. | Land | Improvement |
|---|---|---|---|---|
| 2025 | $426 | $287,669 | $14,806 | $272,863 |
| 2024 | $376 | $275,689 | $16,393 | $259,296 |
| 2023 | $330 | $481,000 | $29,997 | $451,003 |
| 2022 | $316 | $276,100 | $16,498 | $259,602 |
| 2021 | $309 | $394,000 | $29,442 | $364,558 |
| 2020 | $2,638 | $342,000 | $26,886 | $315,114 |
| 2019 | $2,578 | $330,000 | $24,442 | $305,558 |
| 2018 | $2,359 | $301,000 | $22,220 | $278,780 |
| 2016 | $2,058 | $134,319 | $13,220 | $121,099 |
| 2015 | $1,894 | $119,249 | $13,220 | $106,029 |
| 2014 | $1,842 | $121,476 | $13,220 | $108,256 |
| 2013 | -- | $113,775 | $27,595 | $86,180 |
Source: Public Records
Map
Nearby Homes
- 1099 E 2125 N
- 1120 E 2200 N
- 1711 E Amaryllis Way
- 2315 N 1075 E
- 1266 E Larkspur Way
- 1305 E Larkspur Way
- 1020 E 1500 N
- 1340 E Hollyhock Way
- 1354 E Hollyhock Way
- 1465 E Sego Lily Ct
- 1437 E Hollyhock Ct
- 2096 N 1450 E
- 1350 Kays Creek Dr
- 1540 E Primrose Ln
- 1444 E 2400 N
- 1582 Emerald Dr
- 1626 Heather Dr
- 2567 N 1450 E
- 948 E Hercules Ct Unit 179
- 227 E 1500 N
- 883 E Antelope Dr
- 891 E Antelope Dr
- 866 E Antelope Dr
- 890 E Antelope Dr
- 858 E Antelope Dr
- 931 E Antelope Dr
- 931 E 2000 N
- 910 E Antelope Dr
- 856 E Antelope Dr
- 2017 N Fairfield Rd
- 2102 N Fairfield Rd
- 930 E Antelope Dr
- 815 E Antelope Dr
- 1098 E Antelope Dr
- 969 E Antelope Dr
- 979 E Frost Way Unit 117
- 987 E Frost Way
- 1882 N 900 E Unit 109
- 969 E Frost Way
- 2120 N Fairfield Rd
Your Personal Tour Guide
Ask me questions while you tour the home.