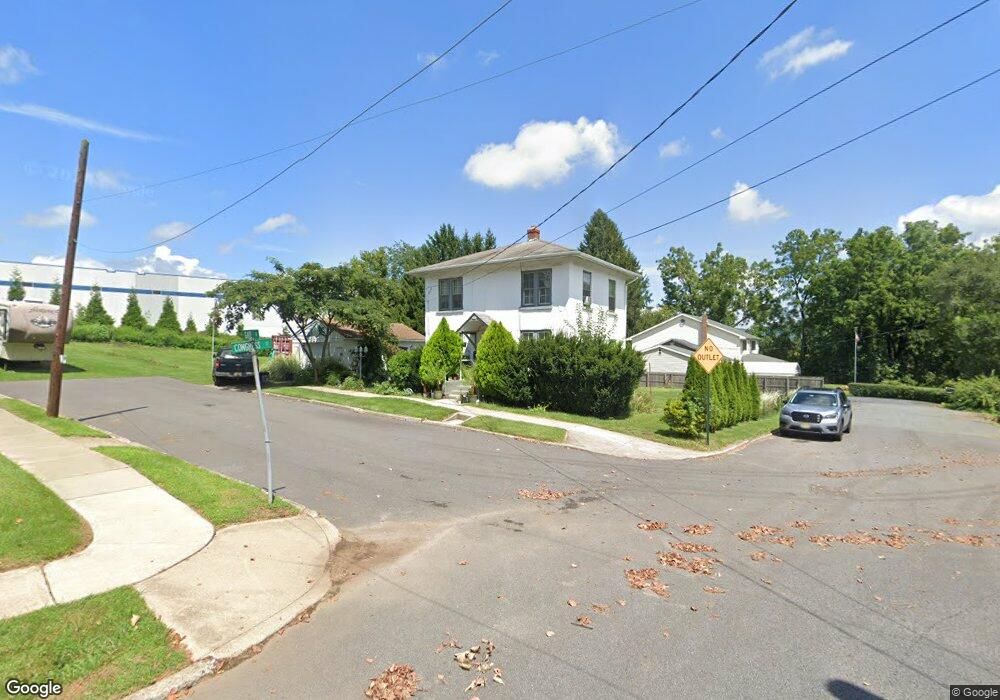
883 Gates St Phillipsburg, NJ 08865
Estimated Value: $178,000 - $298,462
--
Bed
--
Bath
1,000
Sq Ft
$250/Sq Ft
Est. Value
About This Home
This home is located at 883 Gates St, Phillipsburg, NJ 08865 and is currently estimated at $250,366, approximately $250 per square foot. 883 Gates St is a home located in Warren County with nearby schools including Phillipsburg High School, Easton Arts Academy Elementary Cs, and Sts. Philip & James School.
Ownership History
Date
Name
Owned For
Owner Type
Purchase Details
Closed on
Jun 15, 2016
Sold by
Mason William R
Bought by
Mayer James T and Mayer Catherine
Current Estimated Value
Home Financials for this Owner
Home Financials are based on the most recent Mortgage that was taken out on this home.
Original Mortgage
$76,338
Outstanding Balance
$60,934
Interest Rate
3.66%
Mortgage Type
VA
Estimated Equity
$189,432
Purchase Details
Closed on
Oct 23, 2013
Sold by
Mason Blanche and Mason William R
Bought by
Mason William R
Create a Home Valuation Report for This Property
The Home Valuation Report is an in-depth analysis detailing your home's value as well as a comparison with similar homes in the area
Home Values in the Area
Average Home Value in this Area
Purchase History
| Date | Buyer | Sale Price | Title Company |
|---|---|---|---|
| Mayer James T | $73,900 | First Choice Title Agency | |
| Mason William R | -- | None Available |
Source: Public Records
Mortgage History
| Date | Status | Borrower | Loan Amount |
|---|---|---|---|
| Open | Mayer James T | $76,338 |
Source: Public Records
Tax History Compared to Growth
Tax History
| Year | Tax Paid | Tax Assessment Tax Assessment Total Assessment is a certain percentage of the fair market value that is determined by local assessors to be the total taxable value of land and additions on the property. | Land | Improvement |
|---|---|---|---|---|
| 2025 | $4,613 | $101,500 | $36,500 | $65,000 |
| 2024 | $4,259 | $101,500 | $36,500 | $65,000 |
| 2023 | $4,210 | $101,500 | $36,500 | $65,000 |
| 2022 | $4,210 | $101,500 | $36,500 | $65,000 |
| 2021 | $4,075 | $101,500 | $36,500 | $65,000 |
| 2020 | $4,103 | $101,500 | $36,500 | $65,000 |
| 2019 | $4,041 | $101,500 | $36,500 | $65,000 |
| 2018 | $4,041 | $101,500 | $36,500 | $65,000 |
| 2017 | $4,022 | $101,500 | $36,500 | $65,000 |
| 2016 | $3,961 | $101,500 | $36,500 | $65,000 |
| 2015 | $3,930 | $101,500 | $36,500 | $65,000 |
| 2014 | $3,802 | $101,500 | $36,500 | $65,000 |
Source: Public Records
Map
Nearby Homes