Estimated Value: $577,514 - $618,000
3
Beds
3
Baths
2,734
Sq Ft
$221/Sq Ft
Est. Value
About This Home
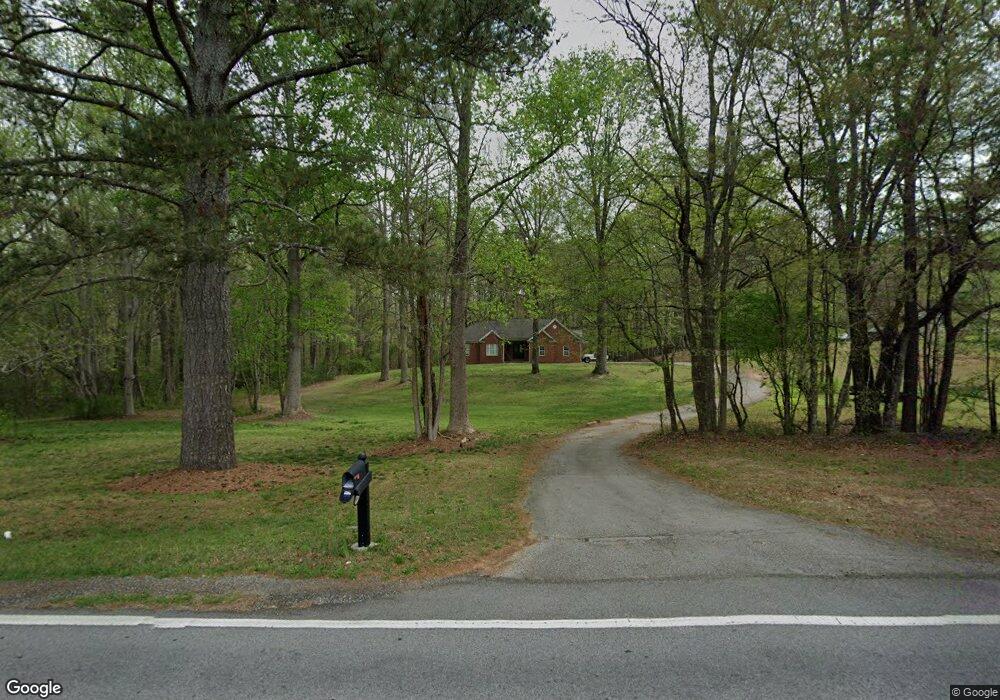
This home is located at 883 Hughes Rd, Hiram, GA 30141 and is currently estimated at $603,171, approximately $220 per square foot. 883 Hughes Rd is a home located in Paulding County with nearby schools including Sam D. Panter Elementary School, J. A. Dobbins Middle School, and Hiram High School.
Ownership History
Date
Name
Owned For
Owner Type
Purchase Details
Closed on
Dec 21, 2006
Sold by
Allen Maureen D
Bought by
Honea Richard B and Honea Susan J
Current Estimated Value
Home Financials for this Owner
Home Financials are based on the most recent Mortgage that was taken out on this home.
Original Mortgage
$271,985
Outstanding Balance
$164,320
Interest Rate
6.5%
Mortgage Type
New Conventional
Estimated Equity
$438,851
Purchase Details
Closed on
Aug 27, 2003
Sold by
Glover Edgar B
Bought by
Gonter Maureen D
Home Financials for this Owner
Home Financials are based on the most recent Mortgage that was taken out on this home.
Original Mortgage
$49,440
Interest Rate
6.33%
Mortgage Type
New Conventional
Create a Home Valuation Report for This Property
The Home Valuation Report is an in-depth analysis detailing your home's value as well as a comparison with similar homes in the area
Home Values in the Area
Average Home Value in this Area
Purchase History
| Date | Buyer | Sale Price | Title Company |
|---|---|---|---|
| Honea Richard B | $70,000 | -- | |
| Gonter Maureen D | $61,800 | -- |
Source: Public Records
Mortgage History
| Date | Status | Borrower | Loan Amount |
|---|---|---|---|
| Open | Honea Richard B | $271,985 | |
| Previous Owner | Gonter Maureen D | $49,440 |
Source: Public Records
Tax History Compared to Growth
Tax History
| Year | Tax Paid | Tax Assessment Tax Assessment Total Assessment is a certain percentage of the fair market value that is determined by local assessors to be the total taxable value of land and additions on the property. | Land | Improvement |
|---|---|---|---|---|
| 2024 | $6,251 | $254,548 | $32,560 | $221,988 |
| 2023 | $6,293 | $243,896 | $31,760 | $212,136 |
| 2022 | $2,365 | $218,448 | $25,840 | $192,608 |
| 2021 | $2,004 | $170,428 | $20,520 | $149,908 |
| 2020 | $1,990 | $155,380 | $19,360 | $136,020 |
| 2019 | $1,861 | $139,640 | $20,520 | $119,120 |
| 2018 | $4,243 | $142,708 | $20,400 | $122,308 |
| 2017 | $1,563 | $123,136 | $19,520 | $103,616 |
| 2016 | $3,149 | $106,000 | $19,520 | $86,480 |
| 2015 | $3,014 | $99,772 | $19,200 | $80,572 |
| 2014 | $2,807 | $90,796 | $17,600 | $73,196 |
| 2013 | -- | $78,440 | $19,320 | $59,120 |
Source: Public Records
Map
Nearby Homes