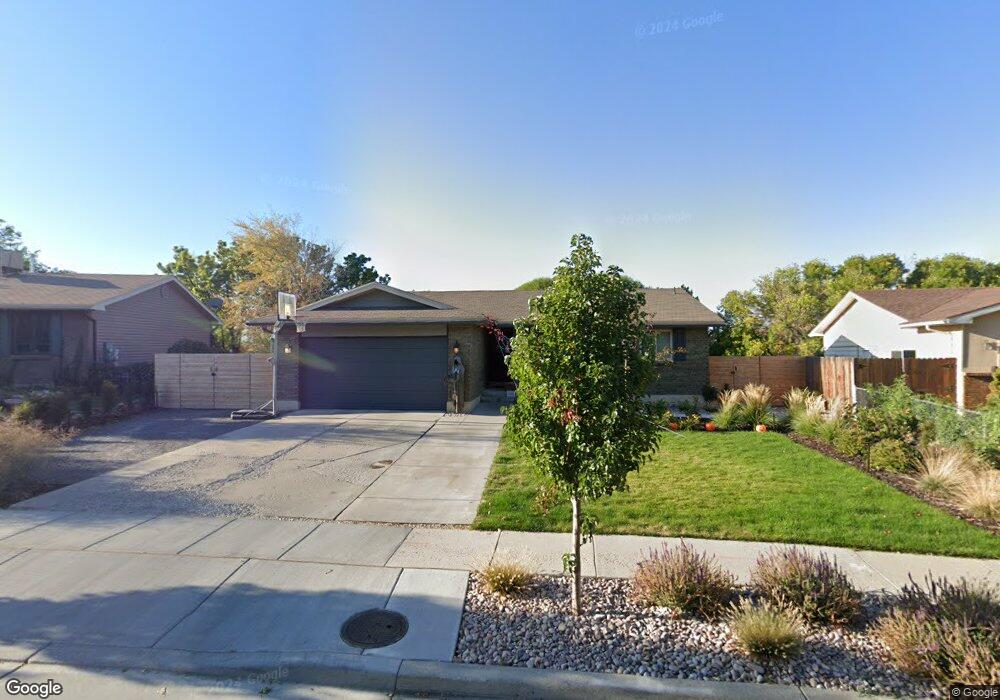
883 Riverbend Dr Salt Lake City, UT 84123
Estimated Value: $567,000 - $608,745
3
Beds
2
Baths
2,496
Sq Ft
$232/Sq Ft
Est. Value
About This Home
This home is located at 883 Riverbend Dr, Salt Lake City, UT 84123 and is currently estimated at $578,936, approximately $231 per square foot. 883 Riverbend Dr is a home located in Salt Lake County with nearby schools including Grant Elementary School, Riverview Junior High School, and Murray High School.
Ownership History
Date
Name
Owned For
Owner Type
Purchase Details
Closed on
May 10, 2023
Sold by
Springer Stephen and Springer Chelsea
Bought by
Springer Chelsea and Springer Stephen
Current Estimated Value
Home Financials for this Owner
Home Financials are based on the most recent Mortgage that was taken out on this home.
Original Mortgage
$60,000
Outstanding Balance
$49,175
Interest Rate
6.32%
Mortgage Type
New Conventional
Estimated Equity
$529,761
Purchase Details
Closed on
Aug 1, 2019
Sold by
Bejtovic Bahudin and Bejtovic Amina
Bought by
Springer Chelsea and Springer Stephen
Home Financials for this Owner
Home Financials are based on the most recent Mortgage that was taken out on this home.
Original Mortgage
$384,750
Interest Rate
3.8%
Mortgage Type
New Conventional
Purchase Details
Closed on
Apr 24, 2017
Sold by
Bejtovic Arijana and Bejtovic Bahudun
Bought by
Bejtovic Bahudin and Bejtovic Amina
Home Financials for this Owner
Home Financials are based on the most recent Mortgage that was taken out on this home.
Original Mortgage
$178,062
Interest Rate
4.3%
Mortgage Type
FHA
Purchase Details
Closed on
Aug 4, 2016
Sold by
Bejtovic Arijana
Bought by
Bejtovic Arijana and Bejtovic Bahudin
Purchase Details
Closed on
Feb 7, 2012
Sold by
Miller Suzanne H
Bought by
Bejtovic Arijana
Home Financials for this Owner
Home Financials are based on the most recent Mortgage that was taken out on this home.
Original Mortgage
$160,817
Interest Rate
3.87%
Mortgage Type
FHA
Purchase Details
Closed on
Jun 22, 2008
Sold by
Miller Suzanne H and Hurst Suzanne H
Bought by
Miller Suzanne H
Home Financials for this Owner
Home Financials are based on the most recent Mortgage that was taken out on this home.
Original Mortgage
$269,990
Interest Rate
5.99%
Mortgage Type
Stand Alone Refi Refinance Of Original Loan
Purchase Details
Closed on
Feb 7, 2005
Sold by
Hurst Mark S
Bought by
Hurst Suzanne H
Purchase Details
Closed on
Apr 26, 2001
Sold by
Hoffman Nancy L
Bought by
Hurst Suzanne H
Home Financials for this Owner
Home Financials are based on the most recent Mortgage that was taken out on this home.
Original Mortgage
$146,970
Interest Rate
6.98%
Mortgage Type
Purchase Money Mortgage
Purchase Details
Closed on
Dec 14, 1998
Sold by
Hoffman Nancy L
Bought by
Hoffman Nancy L
Home Financials for this Owner
Home Financials are based on the most recent Mortgage that was taken out on this home.
Original Mortgage
$80,000
Interest Rate
6.48%
Mortgage Type
Purchase Money Mortgage
Create a Home Valuation Report for This Property
The Home Valuation Report is an in-depth analysis detailing your home's value as well as a comparison with similar homes in the area
Home Values in the Area
Average Home Value in this Area
Purchase History
| Date | Buyer | Sale Price | Title Company |
|---|---|---|---|
| Springer Chelsea | -- | Cottonwood Title | |
| Springer Chelsea | -- | North American Title Llc | |
| Bejtovic Bahudin | -- | Titan Title Ins Agency Inc | |
| Bejtovic Arijana | -- | Accommodation | |
| Bejtovic Arijana | -- | Surety Title | |
| Miller Suzanne H | -- | 1St National Title Ins Agenc | |
| Hurst Suzanne H | $5,000 | -- | |
| Hurst Suzanne H | -- | Salt Lake Title | |
| Hoffman Nancy L | -- | -- |
Source: Public Records
Mortgage History
| Date | Status | Borrower | Loan Amount |
|---|---|---|---|
| Open | Springer Chelsea | $60,000 | |
| Previous Owner | Springer Chelsea | $384,750 | |
| Previous Owner | Bejtovic Bahudin | $178,062 | |
| Previous Owner | Bejtovic Arijana | $160,817 | |
| Previous Owner | Miller Suzanne H | $269,990 | |
| Previous Owner | Hurst Suzanne H | $146,970 | |
| Previous Owner | Hoffman Nancy L | $80,000 |
Source: Public Records
Tax History Compared to Growth
Tax History
| Year | Tax Paid | Tax Assessment Tax Assessment Total Assessment is a certain percentage of the fair market value that is determined by local assessors to be the total taxable value of land and additions on the property. | Land | Improvement |
|---|---|---|---|---|
| 2025 | $2,602 | $598,200 | $168,400 | $429,800 |
| 2024 | $2,602 | $577,100 | $162,700 | $414,400 |
| 2023 | $2,583 | $548,700 | $150,700 | $398,000 |
| 2022 | $2,763 | $557,900 | $147,800 | $410,100 |
| 2021 | $2,398 | $427,200 | $118,200 | $309,000 |
| 2020 | $2,177 | $367,000 | $86,700 | $280,300 |
| 2019 | $1,836 | $299,000 | $86,700 | $212,300 |
| 2018 | $1,607 | $267,100 | $84,700 | $182,400 |
| 2017 | $1,453 | $243,500 | $84,700 | $158,800 |
| 2016 | $1,317 | $213,100 | $84,700 | $128,400 |
| 2015 | $1,586 | $232,900 | $95,300 | $137,600 |
| 2014 | $1,510 | $220,000 | $91,100 | $128,900 |
Source: Public Records
Map
Nearby Homes
- 6080 S 700 W
- 649 Bulldog Cir
- 5964 S 610 W
- 5834 Walden Ridge Dr
- 910 W Brandermill Cove
- 903 W Bullion St
- 913 W Bullion St Unit 10
- 1216 W Winchester St
- 1179 W Dun Robin Ct
- 923 Coalburn Way Unit 103
- 931 Coalburn Way Unit 102
- 937 Coalburn Way Unit 102
- 1193 W Dun Robin Ct
- 924 Coalburn Way Unit 8-26
- 6438 S 840 W
- Hirst 2 Plan at The Gallery at Bullion - Townhomes
- Caro 2 Plan at The Gallery at Bullion - Townhomes
- Sargent Plan at The Gallery at Bullion - Single Family Homes
- Gomez Plan at The Gallery at Bullion - Single Family Homes
- Dexter Plan at The Gallery at Bullion - Single Family Homes
- 883 W Riverbend Dr
- 889 W Riverbend Dr
- 877 Riverbend Dr
- 889 Riverbend Dr
- 878 W Red Oaks Dr
- 878 Red Oaks Dr
- 886 W Red Oaks Dr
- 870 Red Oaks Dr
- 886 Red Oaks Dr
- 895 Riverbend Dr
- 869 Riverbend Dr
- 869 W Riverbend Dr
- 6048 Riverbend Dr
- 6070 River Glen Dr
- 882 Riverbend Dr
- 894 W Red Oaks Dr
- 894 Red Oaks Dr
- 862 Red Oaks Dr
- 836 River Glen Dr
- 836 W River Glen Dr