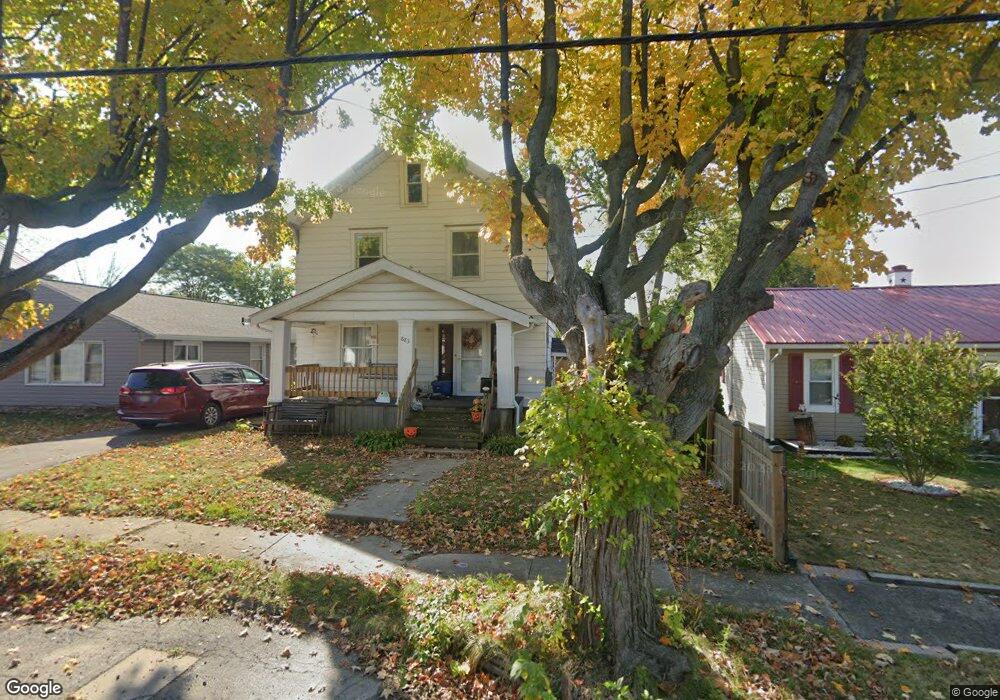
883 Sheridan Rd Marion, OH 43302
Estimated Value: $107,000 - $173,000
3
Beds
1
Bath
1,440
Sq Ft
$104/Sq Ft
Est. Value
About This Home
This home is located at 883 Sheridan Rd, Marion, OH 43302 and is currently estimated at $149,625, approximately $103 per square foot. 883 Sheridan Rd is a home located in Marion County with nearby schools including William McKinley Elementary School, Ulysses S. Grant Middle School, and Harding High School.
Ownership History
Date
Name
Owned For
Owner Type
Purchase Details
Closed on
Jun 25, 2020
Sold by
Gamble Ambrosia M
Bought by
Gamble Canyon A and Gamble Bethany S
Current Estimated Value
Home Financials for this Owner
Home Financials are based on the most recent Mortgage that was taken out on this home.
Original Mortgage
$63,050
Outstanding Balance
$55,909
Interest Rate
3.1%
Mortgage Type
New Conventional
Estimated Equity
$93,716
Purchase Details
Closed on
Nov 28, 2012
Sold by
Gamble Cory G
Bought by
Gamble Ambrosia M
Purchase Details
Closed on
Jan 8, 2007
Sold by
Federal Home Loan Mortgage Corporation
Bought by
Gamble Cory G and Gamble Ambrosia M
Home Financials for this Owner
Home Financials are based on the most recent Mortgage that was taken out on this home.
Original Mortgage
$47,857
Interest Rate
6.16%
Mortgage Type
FHA
Purchase Details
Closed on
Jul 16, 2001
Bought by
Gamble Ambrosia M
Purchase Details
Closed on
Oct 10, 1996
Bought by
Gamble Ambrosia M
Create a Home Valuation Report for This Property
The Home Valuation Report is an in-depth analysis detailing your home's value as well as a comparison with similar homes in the area
Home Values in the Area
Average Home Value in this Area
Purchase History
| Date | Buyer | Sale Price | Title Company |
|---|---|---|---|
| Gamble Canyon A | -- | None Available | |
| Gamble Ambrosia M | $34,100 | None Available | |
| Gamble Cory G | -- | Accommodation | |
| Gamble Ambrosia M | $78,000 | -- | |
| Gamble Ambrosia M | $55,000 | -- |
Source: Public Records
Mortgage History
| Date | Status | Borrower | Loan Amount |
|---|---|---|---|
| Open | Gamble Canyon A | $63,050 | |
| Previous Owner | Gamble Cory G | $47,857 |
Source: Public Records
Tax History Compared to Growth
Tax History
| Year | Tax Paid | Tax Assessment Tax Assessment Total Assessment is a certain percentage of the fair market value that is determined by local assessors to be the total taxable value of land and additions on the property. | Land | Improvement |
|---|---|---|---|---|
| 2024 | $1,227 | $32,740 | $3,370 | $29,370 |
| 2023 | $1,227 | $32,740 | $3,370 | $29,370 |
| 2022 | $1,137 | $32,740 | $3,370 | $29,370 |
| 2021 | $986 | $25,550 | $2,930 | $22,620 |
| 2020 | $987 | $25,550 | $2,930 | $22,620 |
| 2019 | $986 | $25,550 | $2,930 | $22,620 |
| 2018 | $1,062 | $22,790 | $2,910 | $19,880 |
| 2017 | $1,055 | $22,790 | $2,910 | $19,880 |
| 2016 | $885 | $22,790 | $2,910 | $19,880 |
| 2015 | $884 | $22,270 | $2,770 | $19,500 |
| 2014 | $1,208 | $22,270 | $2,770 | $19,500 |
| 2012 | $955 | $23,870 | $2,540 | $21,330 |
Source: Public Records
Map
Nearby Homes
- 786 Sheridan Rd
- 796 Woodrow Ave
- 757 Merkle Ave
- 0 Bellefontaine Ave
- 889 Oak Grove Ave
- 824 Oak Grove Ave
- 720 Woodrow Ave
- 716 Uncapher Ave
- 625 Rochelle Dr
- 1117 Woodrow Ave
- 981 Davids St
- 989 Davids St
- 668 Uncapher Ave
- 645 Henry St
- 681 Davids St
- 579 Henry St
- 1406 Plantation Dr
- 1421 Plantation Dr
- 512 Henry St
- 1133 Amherst Dr
- 889 Sheridan Rd
- 875 Sheridan Rd
- 867 Sheridan Rd
- 884 Chatfield Rd
- 897 Sheridan Rd
- 872 Chatfield Rd
- 863 Sheridan Rd
- 905 Sheridan Rd
- 876 Sheridan Rd
- 888 Sheridan Rd
- 855 Sheridan Rd
- 903 Maynard Dr
- 868 Sheridan Rd
- 864 Sheridan Rd
- 917 Sheridan Rd
- 912 Sheridan Rd
- 868 Chatfield Rd
- 854 Sheridan Rd
- 921 Sheridan Rd
- 847 Sheridan Rd