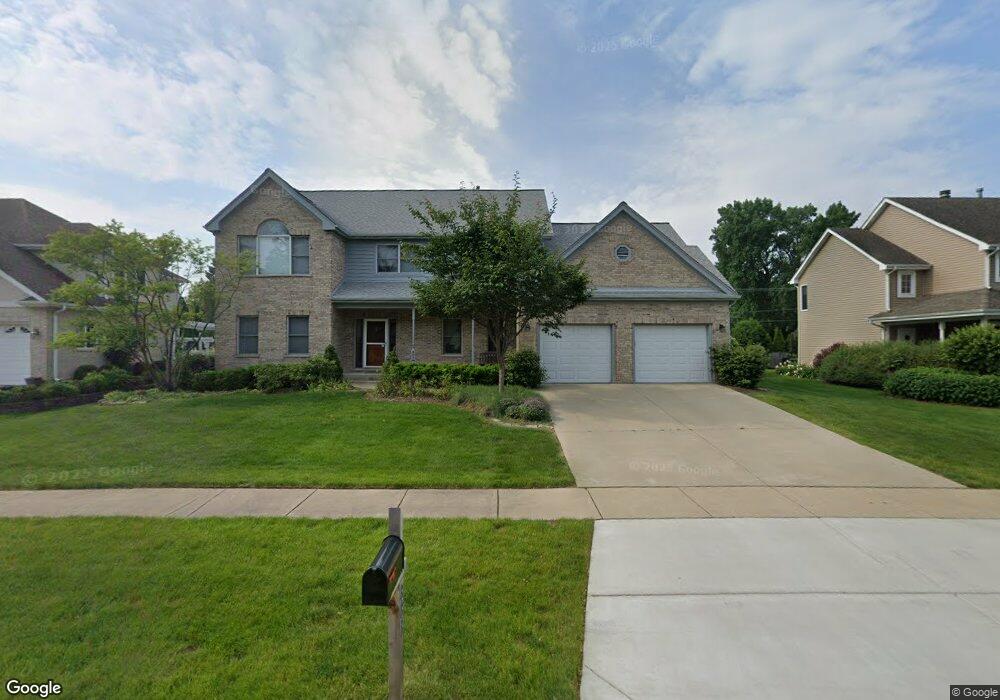
883 W Ellis St Palatine, IL 60067
Plum Grove Village NeighborhoodEstimated Value: $804,437 - $912,000
3
Beds
4
Baths
2,828
Sq Ft
$304/Sq Ft
Est. Value
About This Home
This home is located at 883 W Ellis St, Palatine, IL 60067 and is currently estimated at $858,609, approximately $303 per square foot. 883 W Ellis St is a home located in Cook County with nearby schools including Stuart R Paddock School, Plum Grove Jr High School, and William Fremd High School.
Ownership History
Date
Name
Owned For
Owner Type
Purchase Details
Closed on
Jul 22, 2021
Sold by
Helgren William A and Ochal Lisa A
Bought by
Helgren William A and Ochal Lisa A
Current Estimated Value
Home Financials for this Owner
Home Financials are based on the most recent Mortgage that was taken out on this home.
Original Mortgage
$169,000
Outstanding Balance
$128,216
Interest Rate
2.5%
Mortgage Type
New Conventional
Estimated Equity
$730,393
Purchase Details
Closed on
Jul 18, 2017
Sold by
Helgren William A and Ochal Lisa A
Bought by
Helgren William A and Ochal Lisa A
Purchase Details
Closed on
Jun 15, 1998
Sold by
Kelley Construction Llc
Bought by
Helgren William A and Ochal Lisa A
Home Financials for this Owner
Home Financials are based on the most recent Mortgage that was taken out on this home.
Original Mortgage
$299,900
Interest Rate
5.87%
Create a Home Valuation Report for This Property
The Home Valuation Report is an in-depth analysis detailing your home's value as well as a comparison with similar homes in the area
Home Values in the Area
Average Home Value in this Area
Purchase History
| Date | Buyer | Sale Price | Title Company |
|---|---|---|---|
| Helgren William A | -- | Ravenswood Title Company Llc | |
| Helgren William A | -- | Attorney | |
| Helgren William A | $375,000 | Professional National Title |
Source: Public Records
Mortgage History
| Date | Status | Borrower | Loan Amount |
|---|---|---|---|
| Open | Helgren William A | $169,000 | |
| Closed | Helgren William A | $299,900 |
Source: Public Records
Tax History Compared to Growth
Tax History
| Year | Tax Paid | Tax Assessment Tax Assessment Total Assessment is a certain percentage of the fair market value that is determined by local assessors to be the total taxable value of land and additions on the property. | Land | Improvement |
|---|---|---|---|---|
| 2024 | $15,597 | $56,000 | $7,128 | $48,872 |
| 2023 | $15,059 | $56,000 | $7,128 | $48,872 |
| 2022 | $15,059 | $56,000 | $7,128 | $48,872 |
| 2021 | $13,405 | $44,607 | $4,158 | $40,449 |
| 2020 | $13,278 | $44,607 | $4,158 | $40,449 |
| 2019 | $13,262 | $49,674 | $4,158 | $45,516 |
| 2018 | $13,745 | $47,666 | $3,861 | $43,805 |
| 2017 | $13,504 | $47,666 | $3,861 | $43,805 |
| 2016 | $12,807 | $47,666 | $3,861 | $43,805 |
| 2015 | $13,777 | $47,463 | $3,564 | $43,899 |
| 2014 | $13,626 | $47,463 | $3,564 | $43,899 |
| 2013 | $13,260 | $47,463 | $3,564 | $43,899 |
Source: Public Records
Map
Nearby Homes
- 335 S Crescent Ave
- 834 W Dorchester Rd
- 824 W Dorset Ave
- Lot 2, Nessie's Grov Aldridge Ave
- 635 W Kenilworth Ave
- 108 S Hickory St
- 412 S Cedar St
- 1120 W Wilson St
- 1122 W Wilson St
- 566 W Bridge View Ct
- 222 S Maple St
- Lot 1 W Wilson St
- 971 W Hidden Hills Ln
- 418 S Rose St
- 354 Grayfriars Ln
- 951 W Willow St
- 43 Ravenscraig Ln Unit 34
- 260 N Clyde Ave
- 480 W Wood St Unit 3
- 435 W Wood St Unit 402A
- 869 W Ellis St
- 895 W Ellis St
- 872 W Dorset Ave
- 884 W Dorset Ave
- 860 W Dorset Ave
- 857 W Ellis St
- 945-1 Ellis St
- 870 W Ellis St
- 848 W Dorset Ave
- 862 W Ellis St
- 905 W Ellis St
- 833 W Ellis St
- 858 W Ellis St
- 906 W Dorset Ave
- 902 W Dorset Ave
- 836 W Dorset Ave
- 904 W Ellis St
- 881 W Dorchester Rd
- 881 W Dorchester Rd
- 913 W Ellis St