Estimated Value: $490,000 - $831,165
3
Beds
2
Baths
1,772
Sq Ft
$406/Sq Ft
Est. Value
About This Home
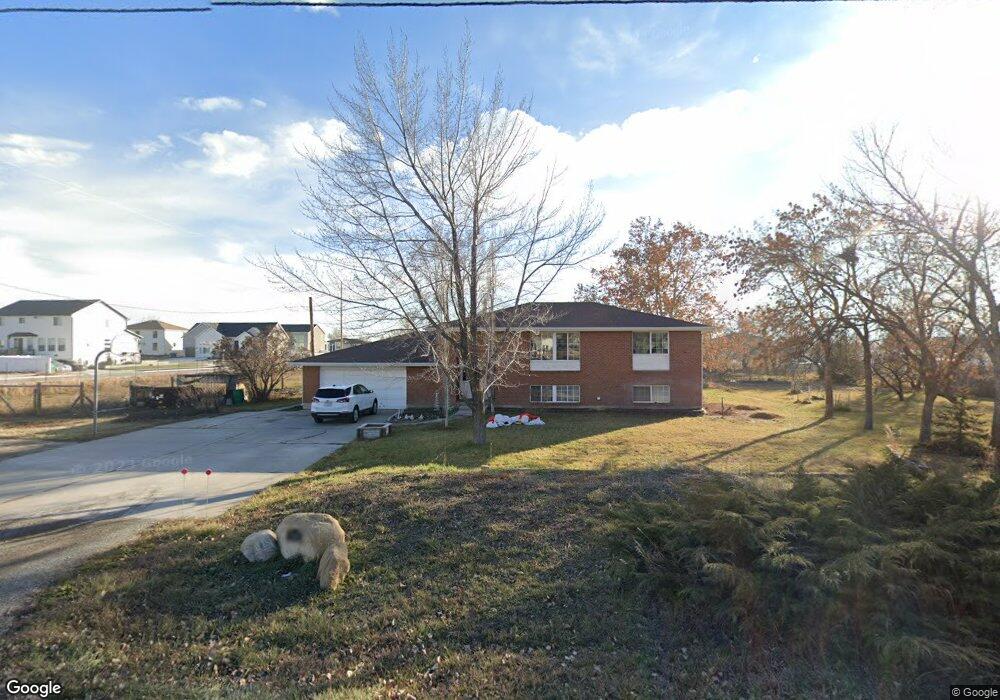
This home is located at 8833 W 9600 N, Lehi, UT 84043 and is currently estimated at $718,791, approximately $405 per square foot. 8833 W 9600 N is a home located in Utah County with nearby schools including Lehi Elementary School, Lehi Junior High School, and Lehi High School.
Ownership History
Date
Name
Owned For
Owner Type
Purchase Details
Closed on
Jun 16, 2016
Sold by
Loverdige Kent and Loverdige Dennis T
Bought by
Loveridge Kent H and Loveridge Vicky
Current Estimated Value
Home Financials for this Owner
Home Financials are based on the most recent Mortgage that was taken out on this home.
Original Mortgage
$303,277
Outstanding Balance
$244,224
Interest Rate
4.4%
Mortgage Type
FHA
Estimated Equity
$474,567
Purchase Details
Closed on
Dec 16, 2013
Sold by
Loveridge Kent H and Loveridge Vicky A
Bought by
Loveridge Kent and Loveridge Dennis T
Home Financials for this Owner
Home Financials are based on the most recent Mortgage that was taken out on this home.
Original Mortgage
$306,584
Interest Rate
4.62%
Mortgage Type
FHA
Purchase Details
Closed on
Oct 27, 2010
Sold by
Loveridge Kent H and Loveridge Vicki A
Bought by
Lehi City
Create a Home Valuation Report for This Property
The Home Valuation Report is an in-depth analysis detailing your home's value as well as a comparison with similar homes in the area
Home Values in the Area
Average Home Value in this Area
Purchase History
| Date | Buyer | Sale Price | Title Company |
|---|---|---|---|
| Loveridge Kent H | -- | Old Republic Title | |
| Loveridge Kent | -- | Metro National Title | |
| Lehi City | -- | Affiliated First Title Comp |
Source: Public Records
Mortgage History
| Date | Status | Borrower | Loan Amount |
|---|---|---|---|
| Open | Loveridge Kent H | $303,277 | |
| Closed | Loveridge Kent | $306,584 |
Source: Public Records
Tax History Compared to Growth
Tax History
| Year | Tax Paid | Tax Assessment Tax Assessment Total Assessment is a certain percentage of the fair market value that is determined by local assessors to be the total taxable value of land and additions on the property. | Land | Improvement |
|---|---|---|---|---|
| 2025 | $3,568 | $441,850 | $401,400 | $324,400 |
| 2024 | $3,568 | $411,395 | $0 | $0 |
| 2023 | $3,302 | $407,585 | $0 | $0 |
| 2022 | $3,393 | $668,500 | $329,700 | $338,800 |
| 2021 | $3,106 | $500,500 | $224,400 | $276,100 |
| 2020 | $2,965 | $467,700 | $209,700 | $258,000 |
| 2019 | $2,751 | $446,700 | $209,700 | $237,000 |
| 2018 | $2,615 | $406,900 | $188,100 | $218,800 |
| 2017 | $2,348 | $218,385 | $0 | $0 |
| 2016 | $2,241 | $191,380 | $0 | $0 |
| 2015 | $2,345 | $191,380 | $0 | $0 |
| 2014 | $2,241 | $182,030 | $0 | $0 |
Source: Public Records
Map
Nearby Homes
- 1332 W 1500 N
- 1094 W 1425 N
- 1610 N 1125 W
- 1249 W 1800 N
- 1272 W 1800 N
- 902 W 1500 N
- 1132 Titan Dr
- 1301 N 900 W Unit 12
- 1627 W Boxwood Dr Unit 110
- 1011 W Mountain Way Unit 316
- 1659 W Boxwood Dr Unit 109
- 1817 W Bad Rock Cir
- 1127 N 1500 W
- 1032 Titan Dr
- 1542 N 1900 W
- 5312 N Springview Ct Unit 106
- 1027 N 3685 W Unit 248
- 2191 W Swift Fox Dr Unit 274
- 999 Empire St
- 2184 W Cape Fox Way N Unit 220
- 10800 N 8800 W
- 1194 W Mitchell Ln Unit 5
- 1238 W 1500 N
- 8720 W 9600 N
- 1187 W 1500 N
- 8795 W 9600 N
- 1230 W 1400 N
- 1174 W Mitchell Ln
- 8850 W 9600 N
- 1193 W Mitchell Ln
- 1157 W 1500 N Unit 2
- 1157 W 1500 N
- 1262 W 1400 N
- 1196 W 1425 N
- 1173 W Mitchell Ln
- 1154 W Mitchell Ln
- 1172 W 1425 N
- 1161 W 1600 N
- 1169 W 1600 N
- 1005 W 1500 N