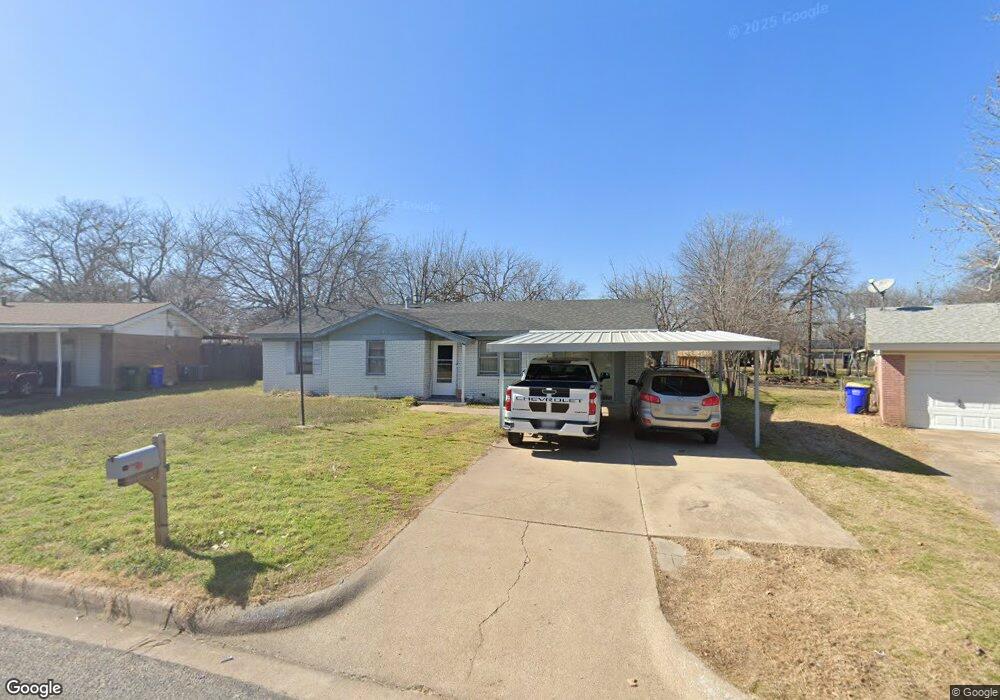
8836 Myra St Fort Worth, TX 76108
Estimated Value: $214,771 - $224,000
3
Beds
1
Bath
1,349
Sq Ft
$163/Sq Ft
Est. Value
About This Home
This home is located at 8836 Myra St, Fort Worth, TX 76108 and is currently estimated at $219,943, approximately $163 per square foot. 8836 Myra St is a home located in Tarrant County with nearby schools including North Elementary School, Brewer Middle School, and Tannahill Intermediate School.
Ownership History
Date
Name
Owned For
Owner Type
Purchase Details
Closed on
Apr 28, 2004
Sold by
Hud
Bought by
Vandort Duncan and Vandort Jennifer
Current Estimated Value
Home Financials for this Owner
Home Financials are based on the most recent Mortgage that was taken out on this home.
Original Mortgage
$56,000
Outstanding Balance
$26,034
Interest Rate
5.38%
Mortgage Type
Purchase Money Mortgage
Estimated Equity
$193,909
Purchase Details
Closed on
Jan 27, 2004
Sold by
Abn Amro Mortgage Group Inc
Bought by
Hud
Purchase Details
Closed on
May 15, 2001
Sold by
Carr Steven E and Carr Theresa Maria
Bought by
Sheeley Christopher M and Sheeley Kimberly D
Home Financials for this Owner
Home Financials are based on the most recent Mortgage that was taken out on this home.
Original Mortgage
$68,918
Interest Rate
6.99%
Mortgage Type
FHA
Create a Home Valuation Report for This Property
The Home Valuation Report is an in-depth analysis detailing your home's value as well as a comparison with similar homes in the area
Home Values in the Area
Average Home Value in this Area
Purchase History
| Date | Buyer | Sale Price | Title Company |
|---|---|---|---|
| Vandort Duncan | -- | -- | |
| Hud | -- | -- | |
| Sheeley Christopher M | -- | Commonwealth Land Title | |
| Abn Amro Mortgage Group Inc | $80,360 | -- |
Source: Public Records
Mortgage History
| Date | Status | Borrower | Loan Amount |
|---|---|---|---|
| Open | Vandort Duncan | $56,000 | |
| Previous Owner | Sheeley Christopher M | $68,918 |
Source: Public Records
Tax History Compared to Growth
Tax History
| Year | Tax Paid | Tax Assessment Tax Assessment Total Assessment is a certain percentage of the fair market value that is determined by local assessors to be the total taxable value of land and additions on the property. | Land | Improvement |
|---|---|---|---|---|
| 2025 | $4,856 | $196,850 | $50,462 | $146,388 |
| 2024 | $4,856 | $205,000 | $50,462 | $154,538 |
| 2023 | $4,754 | $199,950 | $50,462 | $149,488 |
| 2022 | $4,603 | $169,957 | $25,000 | $144,957 |
| 2021 | $3,521 | $128,000 | $25,000 | $103,000 |
| 2020 | $3,547 | $128,000 | $25,000 | $103,000 |
| 2019 | $3,819 | $132,756 | $25,000 | $107,756 |
| 2018 | $2,850 | $99,079 | $11,000 | $88,079 |
| 2017 | $2,226 | $76,189 | $11,000 | $65,189 |
| 2016 | $2,547 | $87,154 | $11,000 | $76,154 |
| 2015 | $1,827 | $63,600 | $11,000 | $52,600 |
| 2014 | $1,827 | $63,600 | $11,000 | $52,600 |
Source: Public Records
Map
Nearby Homes
- 8811 Silver Creek Rd
- 1800 N Las Vegas Trail
- 8832 Kate St
- 813 S Kate St
- 8814 Rockway St
- 627 Hallvale Dr
- 8417 Omaha Dr
- 813 Hackamore St
- 9005 Glenn Dr
- 8814 Clifford St
- 633 Lariat Ln
- 8133 Foxfire Ln
- 914 Ronald St
- 9201 Clifford St
- 8113 Foxfire Ln
- 8401 Clifford St
- 857 Mccully St
- 308 Hallvale Dr
- 304 Lockwood St
- 201 N Normandale St